The Debugger's Toolkit
Understanding the thoughtful art of debugging code
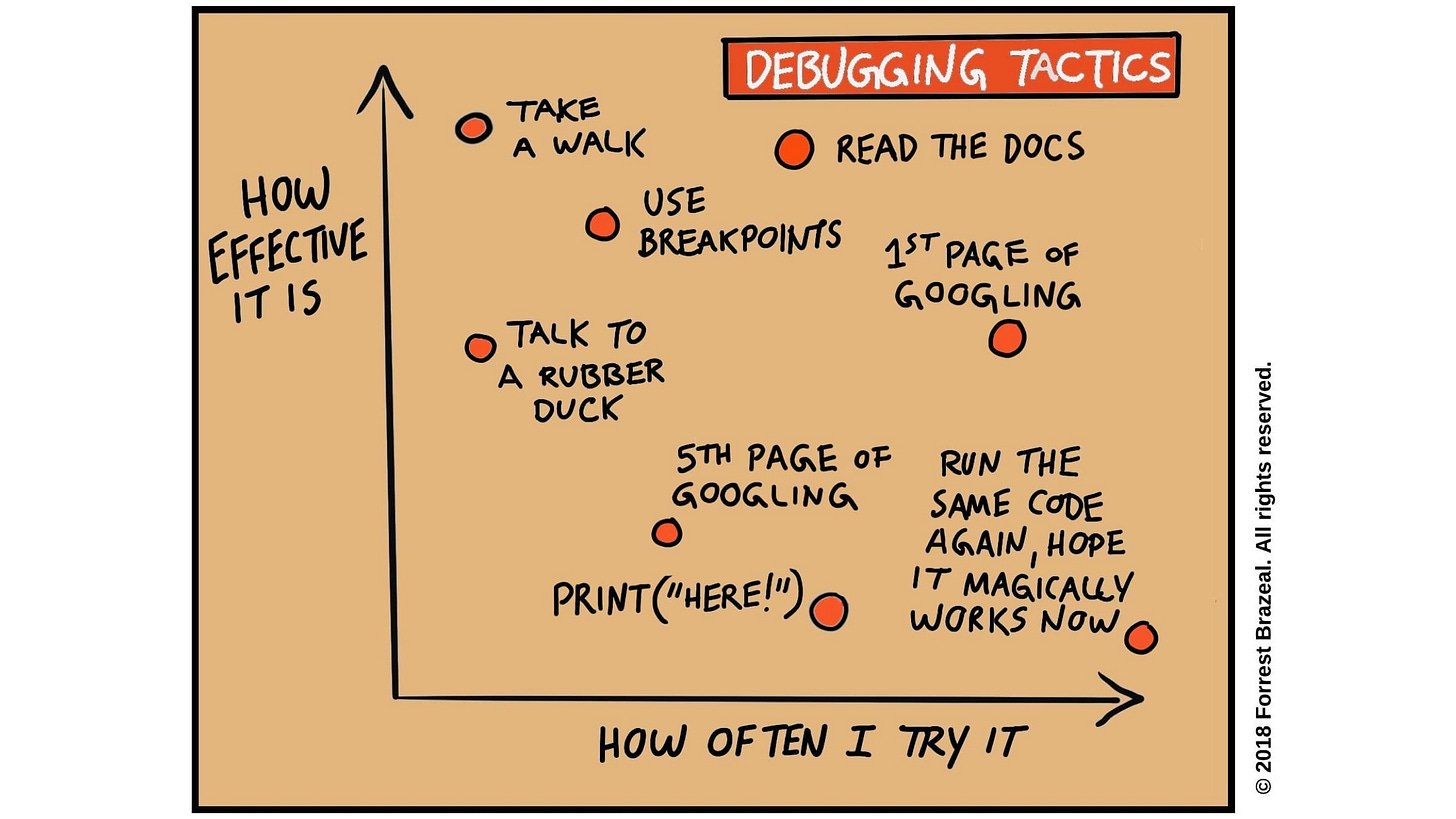
Debugging is an essential skill for any programmer, yet it remains somewhat of a mysterious art. Some developers seem to have an uncanny knack for tracking down bugs quickly, while others struggle with even basic issues. What separates the debugging wizards from the debugging novices?
I have observed some common traits and techniques of master debuggers through our work on Chrome DevTools. The central theme is having a systematic, thoughtful approach rather than haphazardly tweaking code. Let's explore some key principles.
Understand the system
Build a robust mental model first.
Before attempting to diagnose a bug, it's crucial to solidly understand how the overall system and specific subsystem are supposed to work.
Read the documentation, study the architecture diagrams, step through the code, and experiment with normal operation.
When a bug is reported, your mental model is apparently flawed or incomplete in some way. Approach the debugging process as a way to find those flaws and correct your understanding. Which of your assumptions might be invalid?
Reproduce the issue and isolate it
Get a consistent reproduction of the problem.
Once you can make the bug happen on demand, you gain a tighter debugging loop and clearer insights into the failure conditions. Create a minimal test case if possible.
With a reproducible test case, your next goal is to isolate the issue through a process of elimination. Methodically remove or disable components and observe the results. Use a binary search strategy - if the bug still occurs, the problem is in the remaining half of the system. If it doesn't, the culprit was in the now disabled part.
Repeat until you zero in on a specific line of code.
Understand how to reproduce difficult bugs.
For intermittent or hard-to-reproduce bugs, you can be stuck playing a frustrating guessing game. That's why it's worth investing significant effort up front to get a reproducible test case before attempting to fix anything. Resist the temptation to start blindly tweaking code in the hopes of stumbling upon a fix.
The hardest bugs to solve are where nothing seems to happen at all. When you expect the program to do X but instead it just sits there silently, you don't even have a starting point for your investigation.
In these cases, it's crucial to identify the code paths that should have been executed and sprinkle them with debug logging to trace the program's journey. Often you will find it is aborting early or taking an unexpected detour. Knowing what didn't happen can be just as informative as knowing what did.
Form and test hypotheses
Define a few ideas for “why” the bug happens.
As you gather clues and study the code and system, you should be forming hypotheses about potential root causes. Make them as specific as possible, to the level of "the bug happens because X does Y incorrectly due to Z."
Then systematically test each of those hypotheses. Study the relevant code paths and add targeted logging to expose the actual behavior. If the data matches your expectation, the hypothesis was incorrect; move on to the next.
If it differs, you are likely on the right track; drill down further until you completely understand the issue.
Compare to known good
When and did the system last work correctly?
An underutilized debugging technique is finding a similar area of the code that doesn't have the bug and comparing the two implementations.
Often this will highlight an assumption, initialization, or edge case that is being handled correctly in one place but not the other.
This same principle applies to debugging across time as well as space. If a bug was newly introduced, comparing the current code to the last known good version (typically found through version control annotations/blame) will reveal the problematic changes.
Instrument, log and visualize
Instrument enough data to diagnose root causes.
Instrumentation is key to capturing enough information to diagnose the problem. Think carefully about what data is needed and add targeted logging, ideally in a structured format that can be easily queried.
In addition to obvious things like error conditions and exception stack traces, consider logging overall request flow and key decision points in the code.
Sometimes translating the log data into visual form can make patterns pop out. Plot variables over time, render activity as rows on a waterfall chart, or pipe the data into a visualization tool to explore graphically.
Learn about pitfalls experienced developers fall into.
The first is the tendency to play guessing games instead of systematically instrumenting the code and walking through the problem step-by-step. It's natural to have hunches about where the bug might lie based on past experience or code familiarity. Checking those hunches is a fine starting point.
But if those initial guesses don't pan out after a quick investigation, it's crucial to shift into a more methodical approach. Add logging statements or breakpoints to trace the actual code paths being executed. Inspect the program state at each step to validate your assumptions about what should be happening. Let the evidence guide your debugging rather than just taking shots in the dark.
The second trap is finding a bug and immediately assuming it is the root cause you were seeking. In complex systems, many different errors can often produce the same visible symptoms. Smart developers are especially prone to this as they are quick to recognize faults. But that very first bug you find is often just a domino knocked over by the real culprit upstream. Don't declare victory prematurely.
Until you can fully explain the mechanism by which that fault creates the observed problem, keep digging. Make sure the fix actually resolves the original issue before closing the case.
Collaborate and rubber duck
Ask for help if you need it. Talk through the problem.
Even the best programmers sometimes get stuck on a gnarly issue. There is no shame in asking for help. In fact, often the mere act of explaining the problem to another person (or even a rubber duck) can trigger an "aha" moment as you are forced to verbalize your assumptions and reasoning.
Debugging complex systems is fundamentally a collaborative act. Different people have domain expertise in different parts of the codebase or technology stack.
Involving someone with deep knowledge in a particular area can dramatically accelerate the process. And sometimes fresh eyes can spot something that someone too close to the issue glossed over.
Take breaks and leverage the subconscious
Sometimes stepping away briefly is the best debugging technique.
When stumped by a tricky bug, learn to recognize the point of diminishing returns. Continuing to stare at the same code for hours frequently just leads to frustration. Sometimes the most productive thing to do is walk away and take a break.
The subconscious mind is amazingly powerful at working on problems in the background. Go for a walk, take a shower, sleep on it.
Very often the solution will suddenly pop into your head when you are doing something unrelated. Never underestimate the power of putting your brain into diffuse mode.
Learn and share
Finally, don't let the knowledge gained from each debugging session evaporate. Take a few minutes to document the problem and solution, both for your future self and for other team members who may encounter something similar. Consider contributing to the company knowledge base or even writing up a public blog post.
Each bug is an opportunity not just to fix an immediate issue but to deepen your understanding of the system and expand your debugging toolbox. Embrace the challenges and over time you will develop the skills and instincts of a debugging master.
Embrace modern debugging tools
Understand your “full” debugging toolkit
Many developers rely solely on ad hoc print/log statements for debugging. While that can be useful, it is extremely low leverage compared to using powerful debugging tools. Modern IDEs offer visual debuggers, conditional breakpoints, expression evaluation, and even time travel features like reverse execution.
These tools allow you to inspect the full program state at any point, not just whatever you thought to output in a log message. You can set a breakpoint deep in a failing code path and then explore backwards to see how it arrived in that state. You can modify variables and re-execute code to test fixes.
Master debuggers use these advanced tools to accelerate their workflow and gain insights not easily available through print statements alone. And for multithreaded and asynchronous code, a visual representation of thread interactions can be invaluable for detecting race conditions and deadlocks that are otherwise maddeningly difficult to diagnose.
AI-Assisted Debugging
In recent years, the emergence of large language models and AI coding assistants has opened up new possibilities in debugging. Tools like ChatGPT, Gemini, Anthropic's Claude, and GitHub Copilot can serve as a pair-programmer in understanding code, generating explanations and even suggesting fixes.
For example, when puzzling over a particular error message or inscrutable line of code, you can paste it into ChatGPT and ask for an explanation in plain English. The model can provide context on what the code is doing, explain arcane error messages, and even show examples of how to use a particular API correctly.
Going a step further, you can ask the AI to suggest what might be causing a particular bug based on a description of the symptoms. While it may not always guess correctly, it can often point you in a promising direction or suggest things to check. It's like having an extra set of eyes and a research assistant at your fingertips.
Where these AI tools may shine is in their ability to generate code. If you have a hunch about how to fix a bug but are fuzzy on the exact syntax or API calls required, you can ask a tool to write the code for you based on a natural language description or code comment. They can auto-complete entire functions or suggest alternative implementations.
Of course, you shouldn't blindly accept the AI's suggestions. It's crucial to understand and test any generated code. But used judiciously, AI can help you arrive at a correct fix faster, or at least provide a starting point that you can tweak and adapt.
Some caveats and best practices when using AI for debugging:
Be specific in your queries. The more context you can provide about what the code does and what problem you are seeing, the more relevant the AI's responses will be.
Paste in the full error message and any relevant code snippets. Don't make the AI guess based on a vague description.
Critically evaluate any suggested fixes or explanations. The AI can hallucinate or make mistakes, especially on niche topics or bleeding edge technologies. Trust but verify.
Use the AI as an augmentation of your own debugging skills, not a complete replacement. The goal is to leverage it for quick answers and suggestions when you are stuck, not to blindly defer to it.
Be mindful of security and IP concerns. Don't paste sensitive code or data into public AI models. If in doubt, use an in-house or private instance.
Complex debugging scenarios require care
While the general principles of debugging apply across a wide range of situations, some bugs pose extra challenges that require additional strategies and mindset shifts.
Heisenbugs are notoriously difficult to pin down because any attempt to observe them can alter the system's behavior enough to mask the issue.
Symptoms that only manifest under precise timing or resource constraints can disappear when you add instrumentation or attach a debugger. In these cases, you may need to resort to non-invasive logging or capturing and replaying program state to diagnose the problem without disrupting it.
Bugs where the expected behavior simply doesn't occur can be even more perplexing than those that produce a visible error.
You don't have an obvious starting point for your investigation. When nothing happens, it's crucial to proactively log key decision points and code paths. These debug logs become your trail of breadcrumbs to trace the program's journey and identify the point where it deviated from the expected route.
Beware the temptation of debugging by superstition - making a guess, poking around, and latching onto the first bug you find as the presumed culprit.
While intuition can be a helpful guide, it's not a substitute for validating your hypothesis. Always circle back to the original failure mode and confirm that your proposed fix actually resolves the reported symptoms. Resist the siren song of the "aha!" moment until you've tied the cause directly to the effect.
When facing an intractable bug in a complex system, debugging by bisection can be a powerful technique.
By repeatedly removing or simplifying components and checking if the problem persists, you can progressively narrow the search space. This systematic process of elimination is more reliable than flailing around based on hunches.
For codebases or environments with immature debugging tooling, the most valuable skill is the ability to systematically debug with nothing more than well-placed logging statements.
While modern debuggers and profilers are incredibly helpful, debugging mastery is more about the process than the tools. Hone your ability to hypothesize, isolate, and step through code paths mentally. Those skills will serve you well in any environment.
Finally, don't underestimate the impact of attitude and ego on debugging effectiveness.
Overconfidence can lead you to overlook subtle clues, stubbornness can blind you to alternative explanations, and an unwillingness to question assumptions can send you down fruitless rabbit holes. Approach debugging with a spirit of humility, open-mindedness, and persistence. Remember that every bug is an opportunity to refine your mental model, not a personal affront to your skills.
Conclusion
Debugging complex issues is as much art as science. Arm yourself with the right techniques, the right tools, and the right mindset, and you'll be well-equipped to tackle even the most insidious bugs.
And always remember the wise words of Sherlock Holmes: "When you have eliminated the impossible, whatever remains, however improbable, must be the truth." Happy hunting!
Read more
My other work
If you enjoy my writing, you may be interested in one of the recent books I’ve published on topics I’m passionate about. These include “Success at scale” (case studies from the world’s biggest apps), “Building large-scale web apps” (a React field guide) or “Developer Experience”. Enjoy reading whatever form it may take 🙏


