


Note: For those eager to dive deep into how browsers work, an excellent resource is Browser Engineering by Pavel Panchekha and Chris Harrelson (available at browser.engineering). Please do check it out. This article is an overview of how browsers work.
Web developers often treat the browser as a black box that magically transforms HTML, CSS, and JavaScript into interactive web applications. In truth, a modern web browser like Chrome (Chromium), Firefox (Gecko) or Safari (WebKit) is a complex piece of software. It orchestrates networking, parses and executes code, renders graphics with GPU acceleration, and isolates content in sandboxed processes for security.
This article dives into how modern browsers work - focusing on Chromium's architecture and internals, while noting where other engines differ. We'll explore everything from the networking stack and parsing pipeline to the rendering process via Blink, JavaScript engine via V8, module loading, multi-process architecture, security sandboxing, and developer tooling. The goal is a developer-friendly explanation that demystifies what happens behind the scenes.
Let's begin our journey through the browser's internals.
Networking and Resource Loading
Every page load begins with the browser's networking stack fetching resources from the web. When you enter a URL or click a link, the browser's UI thread (running in the "browser process") kicks off a navigation request.
The browser process is the main, controlling process that manages all other processes and the browser's user interface. Everything that happens outside of a specific web page tab is controlled by the browser process.
The steps include:
URL parsing and security checks: The browser parses the URL to determine the scheme (http, https, etc.) and target domain. It also decides if the input is a search query or URL (in Chrome's omnibox, for example). Security features like blocklists may be checked here to avoid phishing sites.
DNS lookup: The network stack resolves the domain name to an IP address (unless it's cached). This may involve contacting a DNS server. Modern browsers might use OS DNS services or even DNS over HTTPS (DoH) if configured, but ultimately they obtain an IP for the host.
Establishing a connection: If no open connection to the server exists, the browser opens one. For HTTPS URLs, this includes a TLS handshake to securely exchange keys and verify certificates. The browser's network thread handles protocols like TCP/TLS setup transparently.
Sending the HTTP request: Once connected, an HTTP GET request (or other method) is sent for the resource. Browsers today default to HTTP/2 or HTTP/3 if the server supports it, which allows multiplexing multiple resource requests over one connection. This improves performance by avoiding the old limit of ~6 parallel connections per host (HTTP/1.1). For example, with HTTP/2 the HTML, CSS, JS, images can all be fetched concurrently on one TCP/TLS link, and with HTTP/3 (over QUIC UDP) setup latency is further reduced.
Receiving the response: The server responds with an HTTP status and headers, followed by the response body (HTML content, JSON data, etc.). The browser reads the response stream. It may need to sniff the MIME type if the Content-Type header is missing or incorrect, to decide how to handle the content. For example, if a response looks like HTML but isn't labeled as such, the browser will still try to treat it as HTML (per permissive web standards). There are security measures here too: the network layer checks Content-Type and may block suspicious MIME mismatches or disallowed cross-origin data (Chrome's CORB - Cross-Origin Read Blocking - is one such mechanism). The browser also consults Safe Browsing or similar services to block known malicious payloads.
Redirects and next steps: If the response is an HTTP redirect (e.g. 301 or 302 with a Location header), the network code will follow the redirect (after informing the UI thread) and repeat the request to the new URL. Only once a final response with actual content is obtained does the browser move on to processing that content.
All these steps happen in the network stack, which in Chromium is run in a dedicated Network Service (now typically a separate process, as part of Chrome's "servicification" effort). The browser process's network thread coordinates the low-level work of socket communication, using the OS networking APIs under the hood. Importantly, this design means the renderer (which will execute the page's code) doesn't directly access the network - it asks the browser process to fetch what it needs, a security win.
Speculative Loading and Resource Optimization
Modern browsers implement sophisticated performance optimizations in the networking stage. Chrome will proactively perform a DNS prefetch or open a TCP connection when you hover over a link or start typing a URL (using the Predictor or preconnect mechanisms) so that if you click, some latency is already shaved off. There's also HTTP caching: the network stack can satisfy requests from the browser cache if the resource is cached and fresh, avoiding a network trip.
Preload scanner operation: Chromium implements a sophisticated preload scanner that tokenizes HTML markup ahead of the main parser. When the primary HTML parser is blocked by CSS or synchronous JavaScript, the preload scanner continues examining the raw markup to identify resources like images, scripts, and stylesheets that can be fetched in parallel. This mechanism is fundamental to modern browser performance and operates automatically without developer intervention. The preload scanner cannot discover resources injected via JavaScript, making such resources likely to be loaded consecutively rather than concurrently.
Early Hints (HTTP 103): Early Hints allows servers to send resource hints while generating the main response, using HTTP 103 status codes. This enables preconnect and preload hints to be sent during server think-time, potentially improving Largest Contentful Paint by several hundred milliseconds. Early Hints are only available for navigation requests and support preconnect and preload directives, but not prefetch.
Speculation Rules API: The Speculation Rules API is a recent web standard that allows defining rules to dynamically prefetch and prerender URLs based on user interaction patterns. Unlike traditional link prefetch, this API can prerender entire pages including JavaScript execution, leading to near-instant load times. The API uses JSON syntax within script elements or HTTP headers to specify which URLs should be speculatively loaded. Chrome has limits to prevent overuse, with different capacity settings based on urgency levels.
HTTP/2 and HTTP/3: Most Chromium-based browsers and Firefox support HTTP/2 fully, and HTTP/3 (based on QUIC) is also widely supported (Chrome has it enabled by default for supporting sites). These protocols improve page load by allowing concurrent transfers and reducing handshake overhead. From a developer perspective, this means you may no longer need sprite sheets or domain sharding tricks - the browser can efficiently fetch many small files in parallel on one connection.
Resource prioritization: The browser also prioritizes certain resources over others. Typically, HTML and CSS are high priority (as they block rendering), scripts might be medium (or high if marked defer/async appropriately), and images maybe lower. Chromium's network stack assigns weights and can even cancel or defer requests to prioritize what's needed for an initial render. Developers can use link rel=preload and Fetch Priority to influence resource prioritization.
By the end of the networking phase, the browser has the initial HTML for the page (assuming it was an HTML navigation). At this point, Chrome's browser process chooses a renderer process to handle the content. Chrome will often launch a new renderer process in parallel with the network request (speculatively) so that it's ready to go when the data arrives. This renderer process is isolated (more on multi-process architecture later) and will take over for parsing and rendering the page.
Once the response is fully received (or as it streams in), the browser process commits the navigation: it signals the renderer process to take the stream of bytes and start processing the page. At this moment, the address bar updates and the security indicator (HTTPS lock, etc.) is shown for the new site. Now the action moves to the renderer process: parsing the HTML, loading sub-resources, executing scripts, and painting the page.
Parsing HTML, CSS, and JavaScript
When the renderer process receives the HTML content, its main thread begins to parse it according to the HTML specification. The result of parsing HTML is the DOM (Document Object Model) - a tree of objects representing the page structure. Parsing is incremental and can interleave with network reading (browsers parse HTML in a streaming fashion, so the DOM can start being built even before the entire HTML file is downloaded).
HTML parsing and DOM construction: HTML parsing is defined by the HTML Standard as a error-tolerant process that will produce a DOM no matter how malformed the markup is. This means even if you forget a closing </p> tag or have nested tags incorrectly, the parser will implicitly fix or adjust the DOM tree so that it's valid. For example, <p>Hello <div>World</div> will automatically end the <p> before the <div> in the DOM structure. The parser creates DOM elements and text nodes for each tag or text in the HTML. Each element is placed in a tree reflecting the nesting in the source.
One important aspect is that the HTML parser may encounter resources to fetch as it goes: for instance, encountering a <link rel="stylesheet" href="..."> will prompt the browser to request the CSS file (on the network thread), and encountering an <img src="..."> will trigger an image request. These happen in parallel to parsing. The parser can keep going while those loads occur, with one big exception: scripts.
Handling <script> tags: If the HTML parser comes across a <script> tag, it pauses parsing and must execute the script before continuing (by default). This is because scripts can use document.write() or other DOM manipulation that can alter the page structure or content that's still coming in. By executing immediately at that point, the browser preserves the correct order of operations relative to the HTML. The parser therefore hands off the script to the JavaScript engine for execution, and only when the script finishes (and any DOM changes it did are applied) can HTML parsing resume. This script execution blocking behavior is why including large <script> files in the head can slow down page rendering - the HTML parsing can't continue until the script is downloaded and run.
However, developers can modify this behavior with attributes: adding defer or async to a <script> tag (or using modern ES module scripts) changes how the browser handles it. With async, the script file is fetched in parallel and executed as soon as it's ready, without pausing HTML parsing (the parse doesn't wait, and the script doesn't guarantee execution in original order relative to other async scripts). With defer, the script is fetched in parallel but execution is deferred until the HTML parsing is done (and will execute in the original order at that later time). In both cases, the parser isn't blocked waiting on the script, which is generally better for performance. ES6 modules (using <script type="module">) are automatically deferred as well (and they can also use import statements - we'll cover module loading separately). By using these techniques, the browser can continue building the DOM without long pauses, making pages load faster.
CSS Parsing and the CSSOM: Alongside HTML, CSS text must be parsed into a structure the browser can work with - often called the CSSOM (CSS Object Model). The CSSOM is essentially a representation of all the styles (rules, selectors, properties) that apply to the document. The browser's CSS parser reads CSS files (or <style> blocks) and turns them into a list of CSS rules (and lots of bloom filters etc to speed up style resolution). Then, as the DOM is being constructed (or once both DOM and CSSOM are ready), the browser will compute the style for each DOM node. This step is usually called style resolution or style calculation. The browser combines the DOM and CSSOM to determine, for each element, which CSS rules apply and what the final computed styles are (after applying the cascade, inheritance, and default styles). The output is often conceptualized as an association of each DOM node with a computed style (the resolved, final CSS properties for that element, e.g. an element's color, font, size, etc.).
It's worth noting that even without any author CSS, every element has default browser styles (the user-agent stylesheet). For example, a <h1> has a default font-size and margin in practically all browsers. The browser's built-in style rules are applied with the lowest priority, and they ensure some reasonable default presentation. Developers can view computed styles in DevTools to see exactly what CSS properties an element ends up with. The style calculation step uses all applicable styles (user agent, user styles, author styles) to finalize each element's styling.
Render-blocking behavior: While HTML parsing can proceed without CSS fully loaded, there is a render-blocking relationship: browsers typically wait to perform the first render until CSS is loaded (for CSS in the <head>). This is because applying an incomplete stylesheet could flash unstyled content. In practice, if a <script> that is not marked async/defer appears before a CSS <link> in HTML, it will additionally wait for the CSS to load before executing the script (since scripts may query style information via DOM APIs). As a rule of thumb, put stylesheet links in the head (they block rendering but are needed early) and put non-critical or large scripts with defer/async or at the bottom so they don't delay DOM parsing.
Now the browser has (1) the DOM constructed from HTML, (2) the CSS rules parsed (CSSOM), and (3) the computed styles for each DOM node. These together form the basis for the next stage: layout. But before moving on, we should consider the JavaScript side in more detail - specifically how the JS engine (V8 in Chrome's case) executes code. We touched on script blocking, but what happens when the JS runs? We'll dedicate a later section to the internals of V8 and JS execution. For now, assume that as scripts run, they might modify the DOM or CSSOM (for example, calling document.createElement or setting element styles). The browser may have to respond to those changes by recalculating styles or layout as needed (which can incur performance costs if done repeatedly). The initial run of scripts during parsing often includes things like setting up event handlers, or maybe manipulating the DOM (e.g. templating). After that, the page is usually fully parsed and we move into layout and rendering.
Styling and Layout
At this stage, the browser's renderer process knows the structure of the DOM and each element's computed style. The next question is: where do all these elements go on the screen? How big are they? This is the job of layout (also known as "reflow" or "layout calculation"). In this phase, the browser calculates the geometry of each element - their size and position - according to the CSS rules (flow, box model, flexbox or grid, etc.) and the DOM hierarchy.
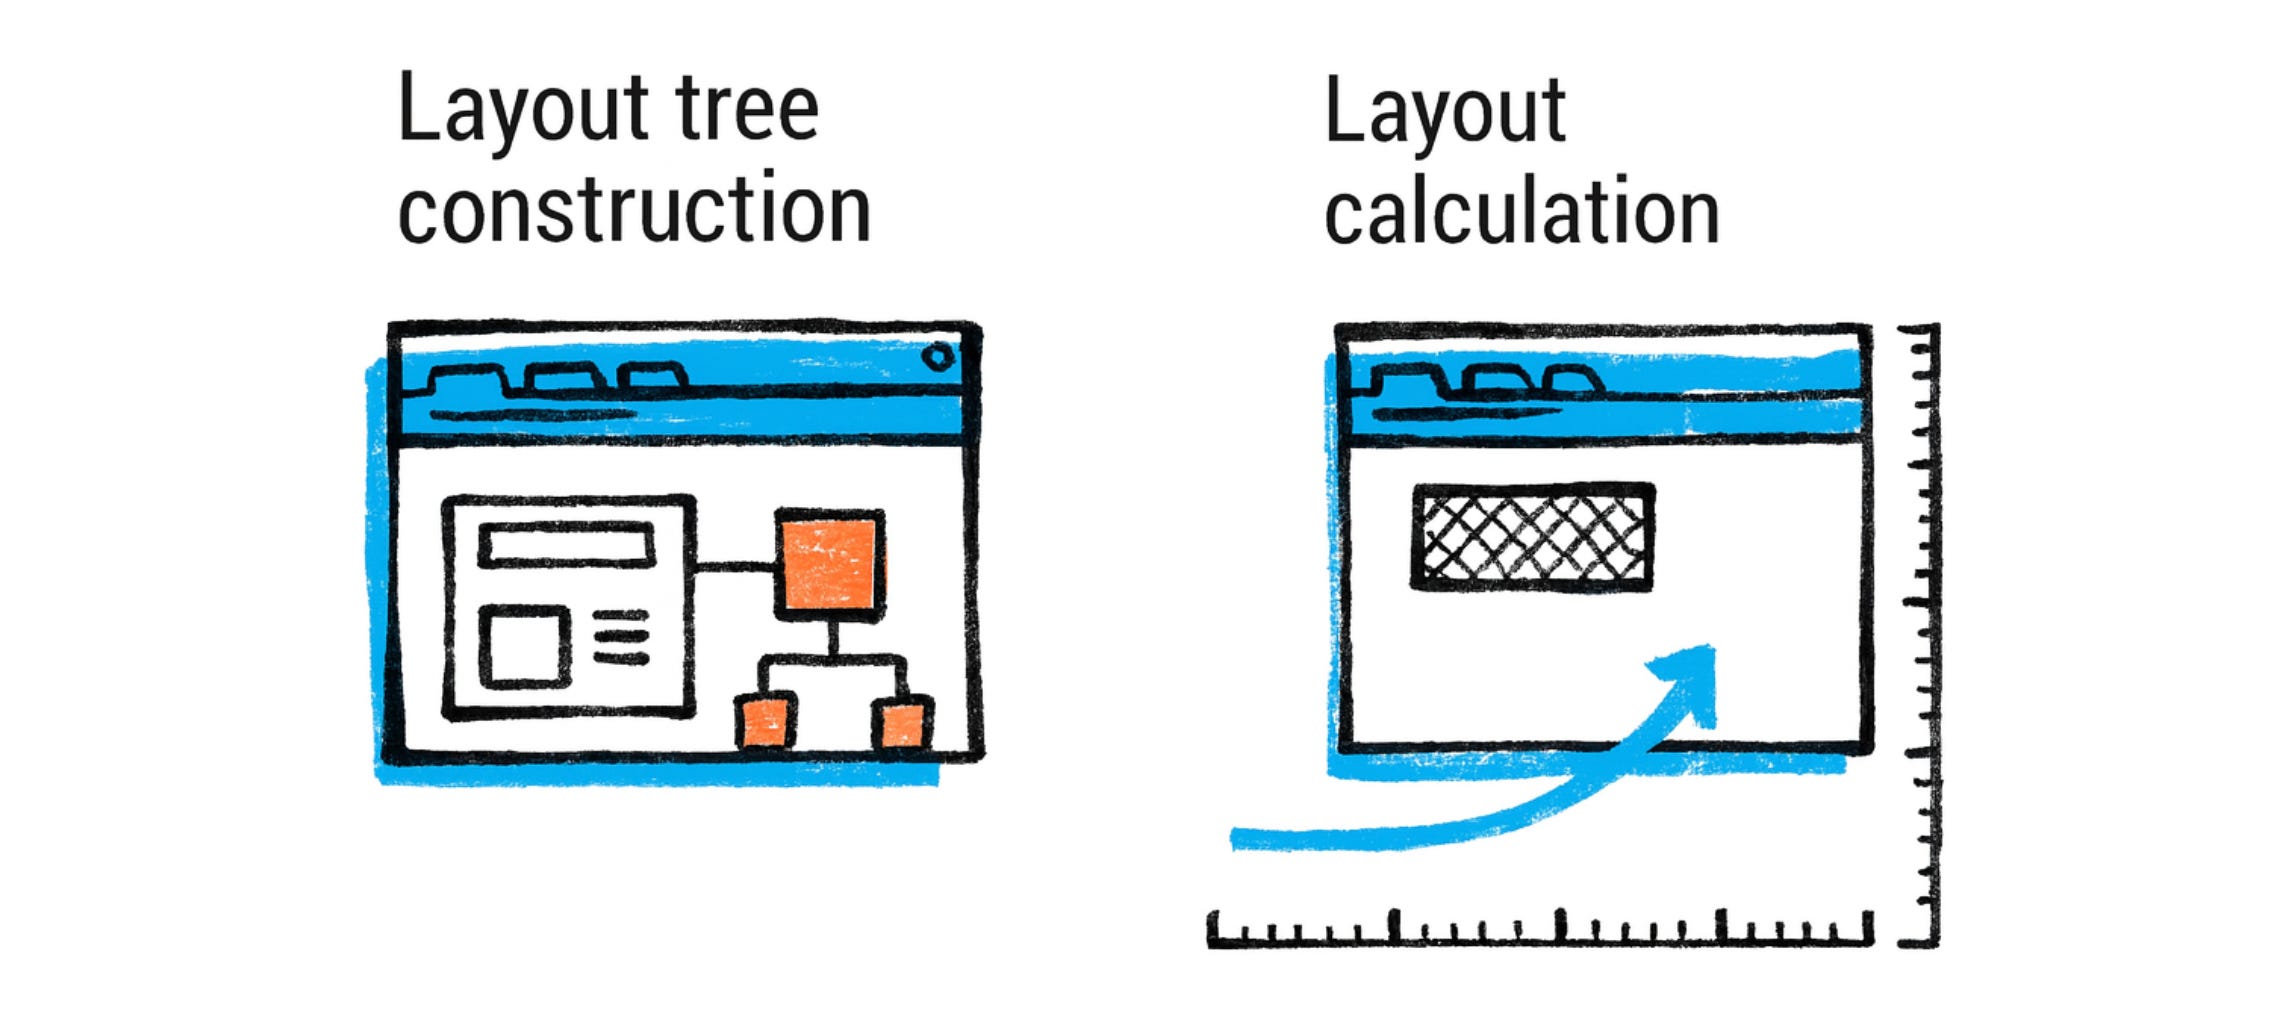
Layout tree construction: The browser walks the DOM tree and generates a layout tree (sometimes called the render tree or frame tree). The layout tree is similar to the DOM tree in structure, but it omits non-visual elements (e.g. script or meta tags don't produce boxes) and may split some elements into multiple boxes if needed (for example, a single HTML element that is flowed across multiple lines might correspond to multiple layout boxes). Each node in the layout tree holds the computed style for that element and has information like the node's content (text or image) and computed properties that affect layout (like width, height, padding, etc.).
During layout, the browser computes the exact position (x, y coordinates) and size (width, height) for each element's box. This involves algorithms defined by CSS specifications: for example, in a normal document flow, block-level elements stack top-to-bottom, each taking full width by default, whereas inline elements flow within lines and cause line breaks as needed. Modern layout modes like flexbox or grid have their own algorithms. The engine has to consider font metrics to break lines (so text layout involves measuring text runs), and it must handle margins, padding, border, etc. There are many edge cases (e.g. margin collapsing rules, floats, absolutely positioned elements that are removed from flow, etc.), making layout a surprisingly complex process. Even a "simple" top-to-bottom layout has to figure out line breaks in text which depend on available width and font sizes. Browser engines have dedicated teams and many years of development to handle layout accurately and efficiently.
Some details about the layout tree:
Elements with display:none are omitted entirely from the layout tree (they don't produce any box). In contrast, elements that are simply not visible (e.g. visibility:hidden) do get a layout box (taking up space), just not painted later.
Pseudo-elements like ::before or ::after that generate content are included in the layout tree (since they do have visual boxes).
The layout tree nodes know their geometry. For example, a <p> element's layout node will know its position relative to the viewport and its dimensions, and have children for each line or inline box inside it.
Layout calculation: Layout is typically a recursive process. Starting from the root (the <html> element), the browser computes the size of the viewport (for <html>/<body>) and then lays out child elements within it, and so on. Many elements' sizes depend on their children or parent (e.g. a container might expand to fit children, or a child might be 50% of its parent's width). The layout algorithm often has to do multiple passes for things like floats or for certain complex interactions, but generally it proceeds in one direction (top-down) with possible backtracking if needed.
By the end of this stage, each element's position and size on the page is known. We can now conceptually think of the page as a bunch of boxes (with text or images inside). But we still haven't actually drawn anything on the screen yet - that's the next step, painting.
However, one key concept: layout can be an expensive operation, especially if done repeatedly. If JavaScript later changes the size of an element or adds content, it can force a relayout of some or all of the page. Developers often hear advice about avoiding layout thrashing (like reading layout info in JS right after modifying DOM, which can force synchronous recalculation). The browser tries to optimize by noting what parts of the layout tree are "dirty" and only recomputing those. But worst-case, changes high up in the DOM could require recalculating the entire layout for large pages. This is why costly style/layout operations should be minimized for better performance.
Style and layout recap: To summarize, from HTML and CSS the browser builds:
DOM tree - structure and content
CSSOM - parsed CSS rules
Computed Styles - the result of matching CSS rules to each DOM node
Layout tree - DOM tree filtered to visual elements, with geometry for each node
Each stage builds on the last. If any stage changes (e.g. if a script alters the DOM or modifies a CSS property), the subsequent stages may need to update. For example, if you change a CSS class on an element, the browser may recalc style for that element (and children if inheritance changes), then might have to redo layout if that style change affects geometry (say display or size), then would have to repaint. This chain means layout and paint are dependent on up-to-date style, and so on. We'll discuss performance implications of this in the DevTools section (as the browser provides tools to see when these steps occur and how long they take).
With layout done, we move to the next major phase: painting.
Painting, Compositing, and GPU Rendering
Painting is the process of taking the structured layout information and actually producing pixels on the screen. In traditional terms, the browser would traverse the layout tree and issue drawing commands for each node ("draw background, draw text, draw image at these coordinates"). Modern browsers still conceptually do this, but they often split the work into multiple stages and leverage the GPU for efficiency.
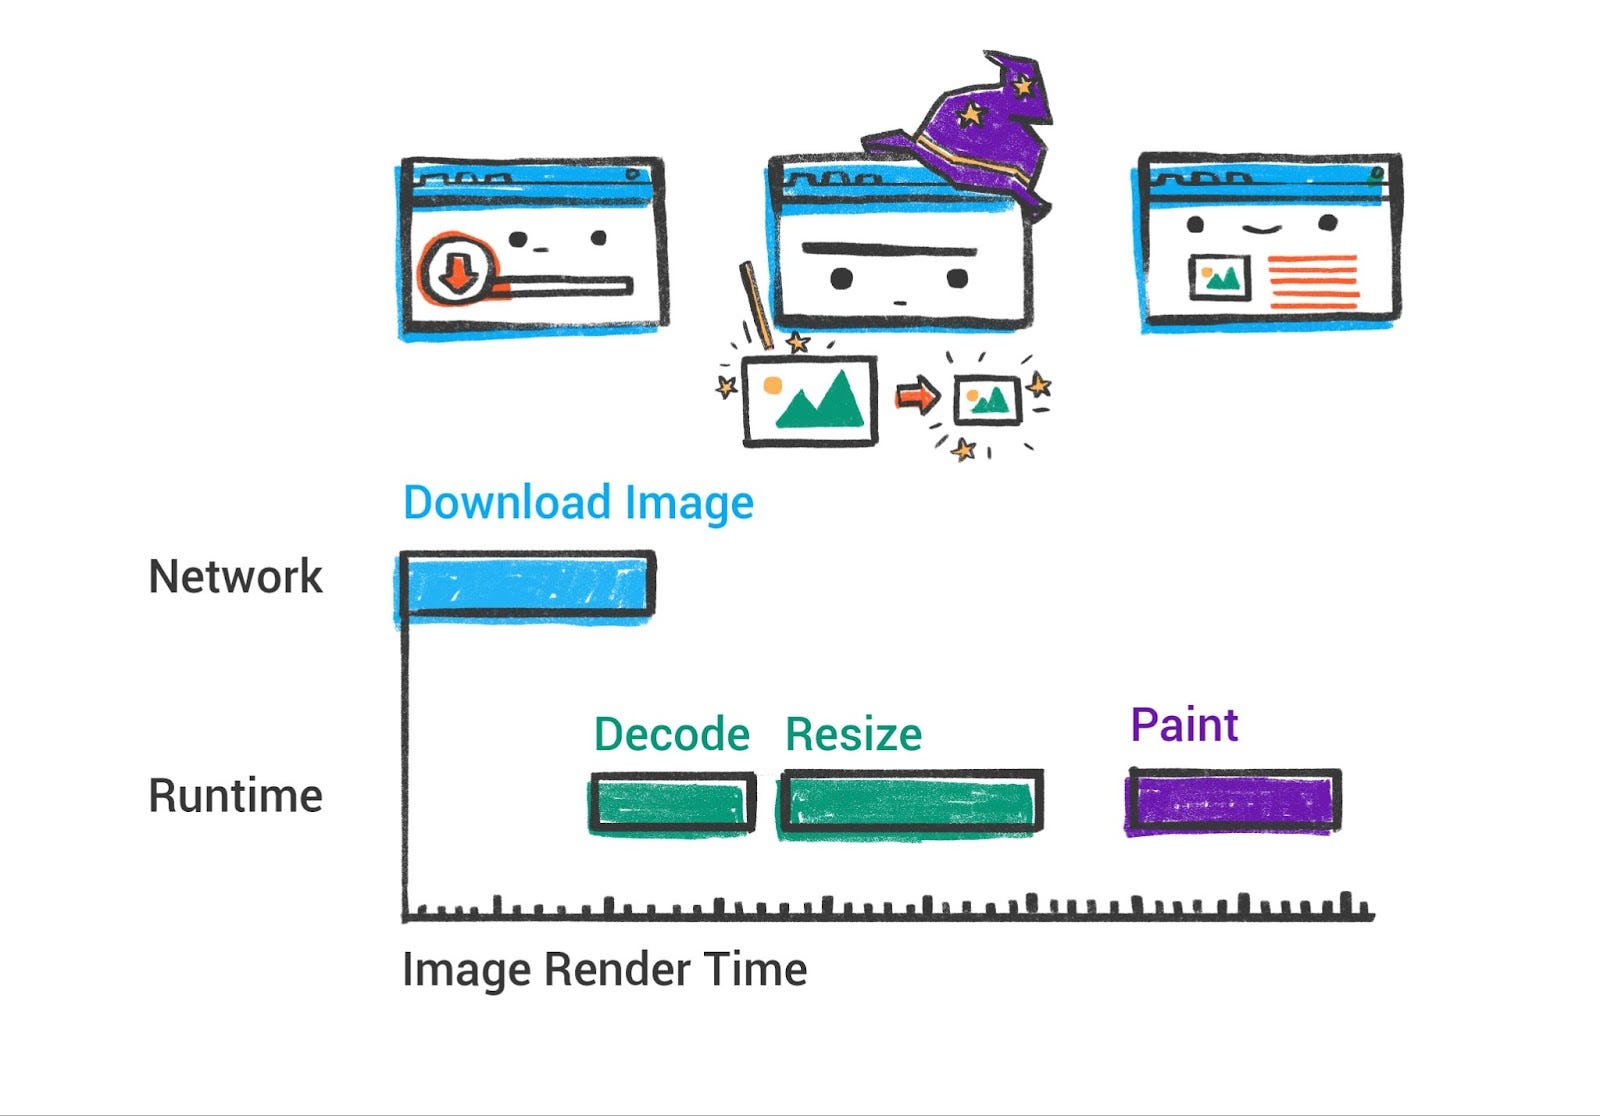
Painting / Rasterization: On the renderer's main thread, after layout, Chrome generates paint records (or a display list) by walking the layout tree. This is basically a list of drawing operations with their coordinates, much like an artist planning how to paint the scene: e.g. "draw rect at (x,y) with width W and height H and fill color blue, then draw text 'Hello' at (x2,y2) with font XYZ, then draw an image at …" and so on. This list is in the correct z-index order (so that overlapping elements paint correctly). For example, if an element has a higher z-index, its paint commands will come later (on top of) lower z-index content. The browser must consider stacking contexts, transparency, etc. to get the right ordering.
In the past, browsers might have simply drawn each element directly to the screen in order. But that approach can be inefficient if parts of the page change (you'd have to repaint everything). Modern browsers instead often record these drawing commands and then use a compositing step to assemble the final image, especially when using GPU acceleration.
Layering and compositing: Compositing is an optimization where the page is split into several layers that can be handled independently. For example, a positioned element with a CSS transform or an animation might get its own layer. Layers are like separate "scratch canvases" - the browser can rasterize (draw) each layer separately, and then the compositor can blend them together on the screen, often using the GPU.
In Chromium's pipeline, after paint records are generated, there's a step to build the layer tree (this corresponds to which elements are on which layer). Some layers are created automatically (e.g. a video element, or a canvas, or elements with certain CSS will be promoted to layers), and developers can hint by using will-change or CSS properties like transform to get a layer. The reason layers are helpful is that movement or opacity changes on a layer can be composited (i.e. just that layer re-rendered or moved) without re-painting the whole page. Too many layers, however, can be memory-heavy and add overhead, so browsers choose carefully.
After determining layers, Chrome's main thread hands off to the compositor thread. The compositor thread runs in the renderer process but separate from the main thread (so it can keep working even if the main JS thread is busy, which is great for smooth scrolling and animations). The compositor thread's job is to take the layers, rasterize them (convert the drawings into actual pixel bitmaps), and compose them into frames.
Rasterization with GPU assistance: Raster work can also be distributed. In Chrome, the compositor thread breaks layers into smaller tiles (think 256x256 or 512x512 pixel chunks, which are often larger when GPU raster is on, almost always). It then dispatches these to several raster worker threads (which may even run across multiple CPU cores) for concurrent rasterization. Each raster worker takes a tile - essentially a list of drawing commands for that region of a layer - and produces a bitmap (pixel data). Importantly, Skia (Chrome's graphics library) can use the CPU or GPU to rasterize; in Chrome's case, these raster threads typically use CPU to render the pixels and then upload them to GPU memory. Firefox's newer WebRender takes a different approach we'll mention later. The rasterized tiles are stored in GPU memory as textures. Once all needed tiles are drawn, the compositor thread has essentially a set of textured layers ready.
The compositor then assembles a compositor frame - basically a message to the browser process that includes all the quads (tiles of layers) that make up the screen, their positions, etc. This compositor frame is submitted via IPC back to the browser process, where ultimately the browser's GPU process (a separate process in Chrome for accessing GPU) will take these and display them. The browser process's own UI (like the tab bar) is also drawn via compositor frames, and they all get mixed in the final step. The GPU process receives the frames, and uses the GPU (via OpenGL/DirectX/Metal etc.) to composite them - basically drawing each texture at the right place on screen, applying transforms, etc. very fast. The result is the final image you see displayed.
The advantage of this pipeline is apparent when you scroll or animate. For example, scrolling a page mostly just changes the viewport on a larger page texture. The compositor can just shift the layer positions and ask the GPU to redraw the new portion coming into view, without the main thread having to repaint everything. If an animation is just a transform (say moving an element that is its own layer), the compositor thread can update that element's position each frame and produce new frames without involving the main thread or re-running style and layout. This is why animations that are "compositing-only" (changing transform or opacity, which don't trigger layout) are recommended for better performance - they can run at 60 FPS smoothly even if the main thread is busy. In contrast, animating something like height or background-color might force re-layout or re-paint each frame, which janks if the main thread can't keep up.
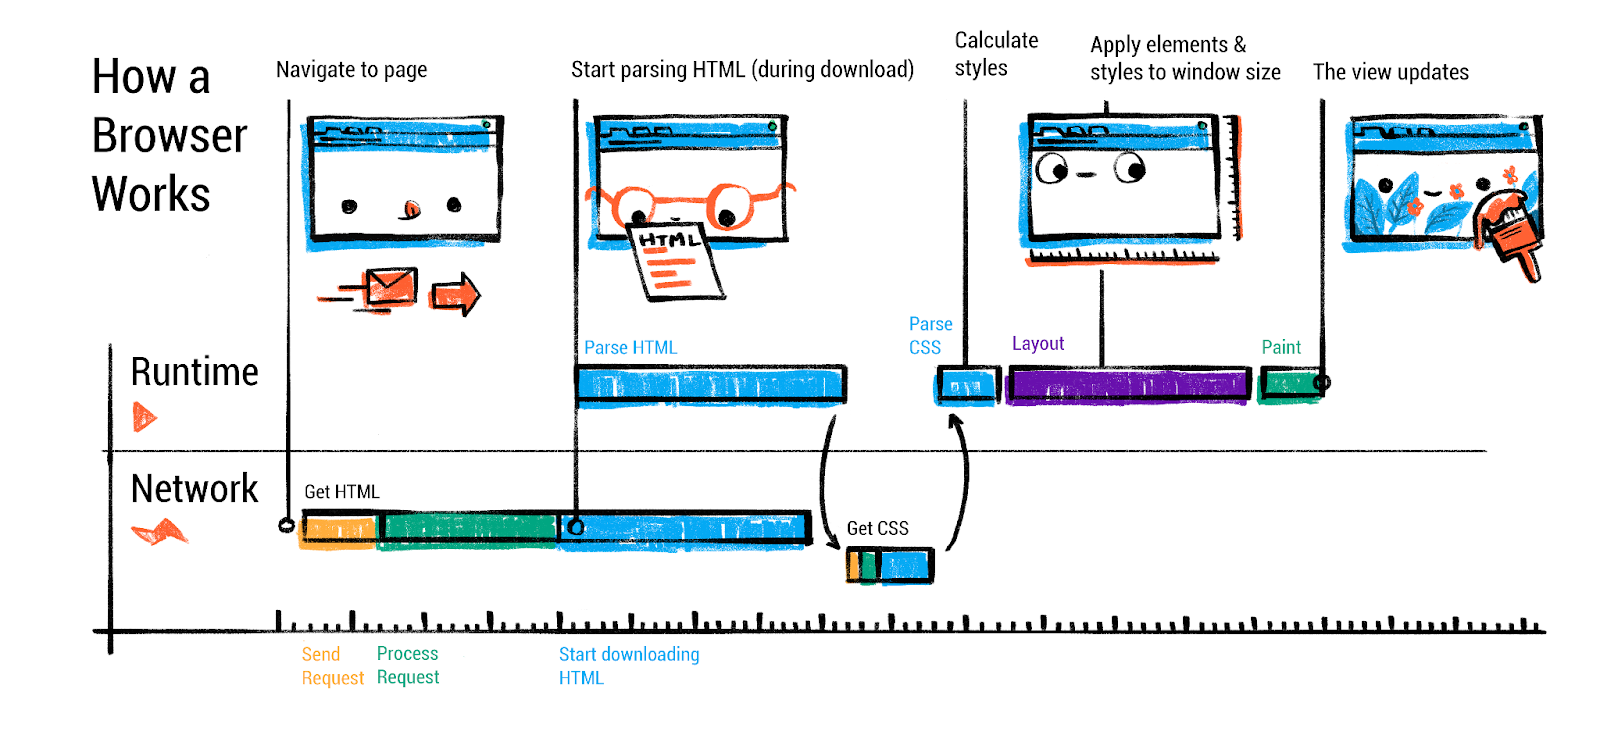
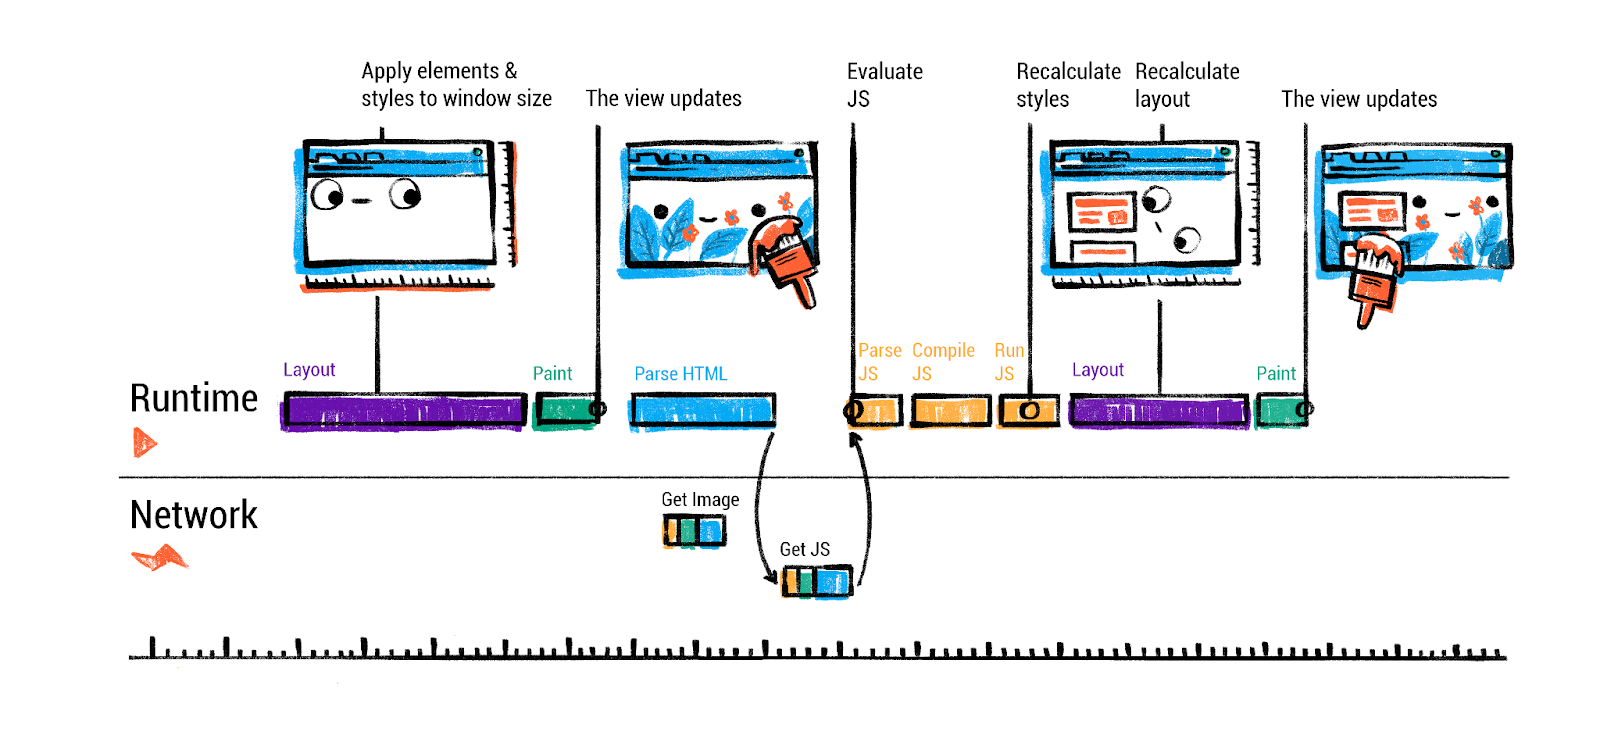
To put it succinctly, Chrome's rendering pipeline is: DOM → style → layout → paint (record display items) → layerize → raster (tiles) → composite (GPU). Firefox's pipeline is conceptually similar up to the display list stage, but with WebRender it skips explicit layer construction and instead sends a display list to the GPU process, which then handles almost all drawing using GPU shaders (more on this in the comparison section). WebKit (Safari) also uses a multi-threaded compositor and GPU rendering via "CALayers" on macOS. All modern engines thus take advantage of GPUs for rendering, especially for compositing and rasterizing graphics-intensive parts, to achieve high frame rates and offload work from the CPU.
Before moving on, let's discuss the GPU's role in more detail. In Chromium, the GPU process is a separate process whose job is to interface with the graphics hardware. It receives drawing commands (mostly high-level, like "draw these textures at these coords") from all renderer compositors and also the browser UI. It then translates that into actual GPU API calls. By isolating it in a process, a buggy GPU driver that crashes won't take down the whole browser - only the GPU process, which can be restarted. Also, it provides a sandbox boundary (since GPUs process potentially untrusted content like canvas drawing, WebGL, etc. there have been security bugs in drivers - running them out-of-process mitigates risk).
The result of the compositing is finally sent to the display (the OS window or context the browser is running in). For each animation frame (target 60fps or 16.7ms per frame for smooth results), the compositor aims to produce a frame. If the main thread is busy (say JavaScript took a long time), the compositor might skip frames or can't update, leading to visible jank. Developer tools can show dropped frames in the performance timeline. Techniques like requestAnimationFrame align JS updates to frame boundaries to help with smooth rendering.
In summary, the browser's rendering engine carefully breaks down the page content and styles into a set of geometry (layout) and drawing instructions, then uses layers and GPU compositing to efficiently turn that into the pixels you see. This complex pipeline is what enables the rich graphics and animations on the web to run at interactive frame rates. Next, we will peek into the JavaScript engine to understand how the browser executes scripts (which we've so far treated as a black box).
Inside the JavaScript Engine (V8)
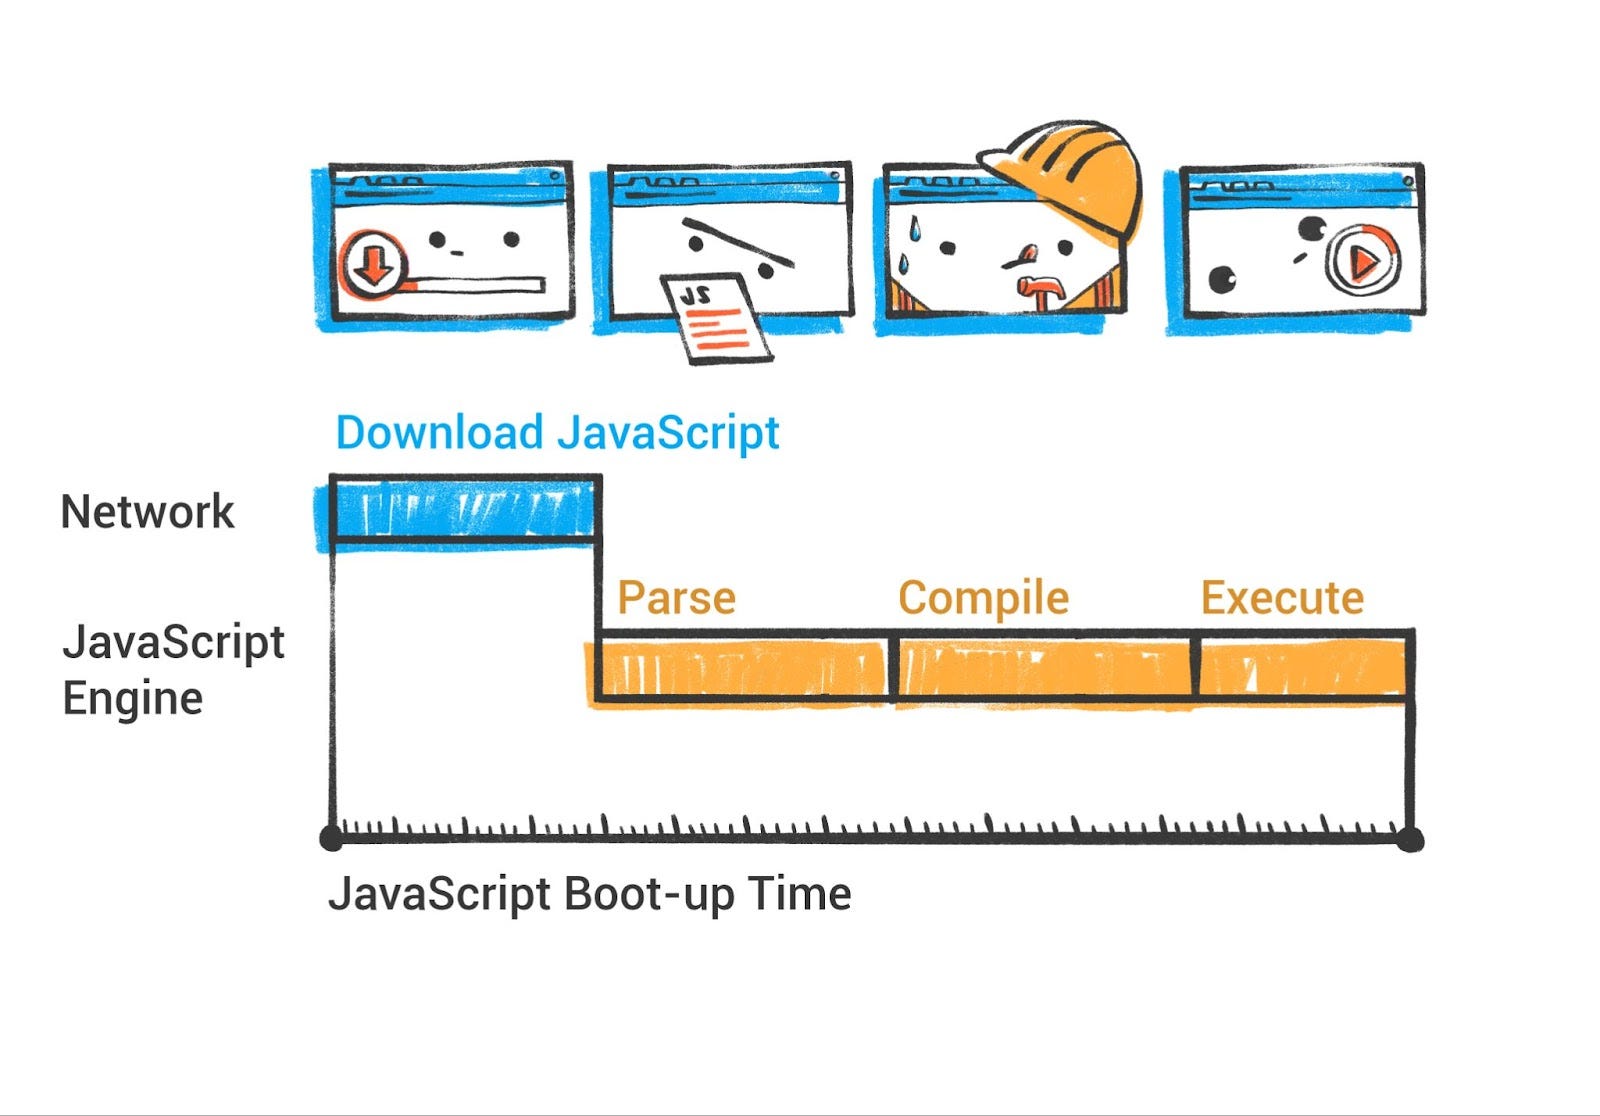
JavaScript drives the interactive behavior of web pages. In Chromium browsers, the V8 engine executes JavaScript (and WebAssembly). Understanding V8's workings can help developers write performant JS. While an exhaustive deep-dive would be book-length, we'll focus on the key stages of the JS execution pipeline: parsing/compiling the code, executing it, and managing memory (garbage collection). We'll also note how V8 handles modern features like Just-In-Time (JIT) compilation tiers and ES modules.
Modern V8 Parsing and Compilation Pipeline
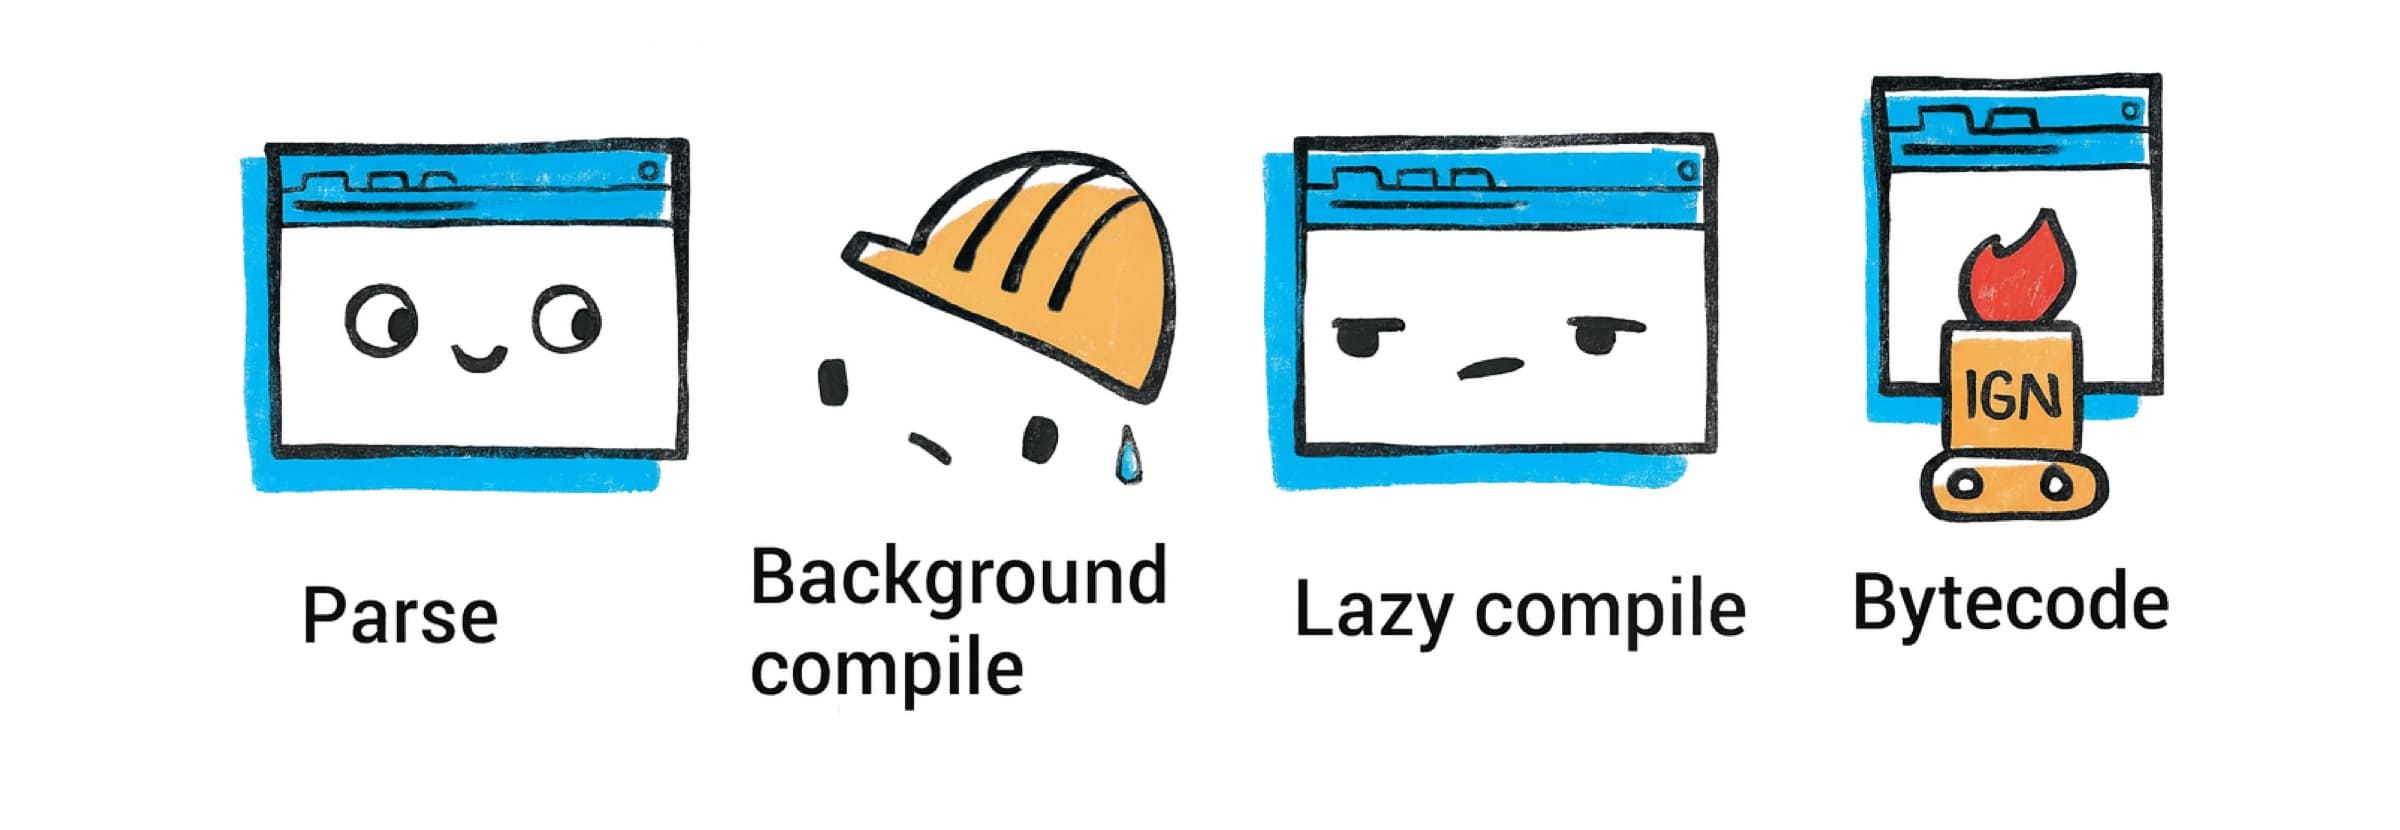
Background compilation: Starting with Chrome 66, V8 compiles JavaScript source code on a background thread, reducing the amount of time spent compiling on the main thread by between 5% to 20% on typical websites. Since version 41, Chrome has supported parsing of JavaScript source files on a background thread via V8's StreamedSource API. V8 can start parsing JavaScript source code as soon as the first chunk is downloaded from the network and continue parsing in parallel while streaming the file. Almost all script compilation occurs on background threads, with only short AST internalization and bytecode finalization steps happening on the main thread just before script execution. Currently, top-level script code and immediately invoked function expressions are compiled on background threads, while inner functions are still compiled lazily on the main thread when first executed.
Parsing and bytecode: When a <script> is encountered (either during HTML parse or loaded later), V8 first parses the JavaScript source code. This produces an Abstract Syntax Tree (AST) representation of the code. The preparser is a copy of the parser that does the bare minimum needed to skip over functions. It verifies that functions are syntactically valid and produces all information needed for outer functions to be compiled correctly. When a preparsed function is later called, it is fully parsed and compiled on-demand.
Rather than interpreting directly from the AST, V8 uses a bytecode interpreter called Ignition (introduced in 2016). Ignition compiles the JavaScript into a compact bytecode format, which is essentially a sequence of instructions for a virtual machine. This initial compilation is quite fast and the bytecode is fairly low-level (Ignition is a register-based VM). The goal is to start executing the code quickly with minimal upfront cost (important for page load times).
AST internalization process: AST internalization involves allocating literal objects (strings, numbers, object-literal boilerplate) on the V8 heap for use by generated bytecode. To enable background compilation, this process was moved later in the compilation pipeline, after bytecode compilation, requiring modifications to access raw literal values embedded in the AST instead of internalized on-heap values.
Explicit Compile Hints: V8 has introduced a new feature called "Explicit Compile Hints" which allows developers to instruct V8 to parse and compile code immediately on load through eager compilation. Files with this hint are compiled on background threads, whereas deferred compilation happens on the main thread. Experiments with popular web pages showed performance improvements in 17 out of 20 cases, with an average 630ms reduction in foreground parse and compile times. Developers can add explicit compile hints to JavaScript files using special comments to enable eager compilation on background threads for critical code paths.
Scanner and parser optimizations: V8's scanner has been significantly optimized, resulting in improvements across the board: single token scanning improved by roughly 1.4×, string scanning by 1.3×, multiline comment scanning by 2.1×, and identifier scanning by 1.2-1.5× depending on identifier length.
When the script runs, Ignition interprets the bytecode, executing the program. Interpretation is generally slower than optimized machine code, but it allows the engine to start running and also collect profiling information about the code's behavior. As the code runs, V8 gathers data on how it's being used: types of variables, which functions are called frequently, etc. This information will be used to make the code run faster in subsequent steps.
JIT Compilation Tiers
V8 doesn't stop at interpretation. It employs multiple tiers of Just-In-Time compilers to accelerate hot code. The idea is to spend more compilation effort on code that runs a lot, to make it faster, while not wasting time optimizing code that runs only once.
Ignition (interpreting the bytecode).
Sparkplug: V8's baseline JIT called Sparkplug (launched around 2021). Sparkplug takes the bytecode and compiles it to machine code quickly, without heavy optimizations. This yields native code that is faster than interpretation but Sparkplug doesn't do deep analysis - it's meant to be almost as quick as the interpreter to start, but produce code that runs a bit faster.
Maglev: In 2023, V8 introduced Maglev, a mid-tier optimizing compiler that is now actively deployed. Maglev generates code nearly 20 times slower than Sparkplug but 10 to 100 times faster than TurboFan, effectively bridging the gap for functions that are moderately hot but not hot enough for TurboFan optimization. Maglev comes into play for functions that are somewhat hot but not hot enough for TurboFan, or when TurboFan's compilation would be too costly. As of Chrome M117, Maglev can handle many cases, resulting in faster startup for web apps that spend time in "warm" code (not cold, not super hot) by bridging the gap between baseline and highest-tier JIT.
TurboFan: As functions or loops get executed many times, V8 will engage its most powerful optimizing compiler. TurboFan takes the code and uses the collected type feedback to generate highly optimized machine code, applying advanced optimizations (inlining functions, eliding bounds checks, etc.). This optimized code can run much faster if the assumptions hold.
So V8 now effectively has four execution tiers: Ignition interpreter, Sparkplug baseline JIT, Maglev optimizing JIT, and TurboFan optimizing JIT. This is analogous to how Java's HotSpot VM has multiple JIT levels (C1 and C2). The engine can dynamically decide which functions to optimize and when, based on execution profiles. If a function suddenly is called a million times, it will likely end up TurboFan-optimized for maximum speed.
Intel has also developed Profile-Guided Tiering that enhances V8's efficiency, leading to approximately 5% improvement on Speedometer 3 benchmarks. Recent V8 updates include static roots optimization, which allows accurate prediction of memory addresses at compile time for commonly used objects, significantly improving access speed.
One challenge with JIT optimization is that JavaScript is dynamically typed. V8 might optimize code under certain assumptions (e.g. this variable is always an integer). If a later call violates those assumptions (say the variable becomes a string), the optimized code is invalid. V8 then performs a deoptimization: it falls back to a less optimized version (or re-generates code with new assumptions). This mechanism relies on "inline caches" and type feedback to quickly adapt. The existence of deopt means sometimes peak performance isn't sustained if your code has unpredictable types, but generally V8 tries to handle typical patterns (like a function consistently being passed the same type of object).
Bytecode Flushing and Memory Management
V8 implements bytecode flushing where if a function remains unused after multiple garbage collections, its bytecode will be reclaimed. When executed again, the parser uses previously stored results to regenerate the bytecode more quickly. This mechanism is crucial for memory management but can lead to parsing inconsistencies in edge cases.
Memory Management (Garbage Collection): V8 automatically manages memory for JS objects using a garbage collector. Over the years, V8's GC has evolved into what's known as the Orinoco GC, which is a generational, incremental, and concurrent garbage collector. Key points:
Generational: V8 segregates objects by age. New objects are allocated in the young generation (or "nursery"). These are collected frequently with a very fast scavenging algorithm (copying live objects to a new space and reclaiming the rest). Objects that survive enough cycles get promoted to the old generation.
Mark-and-sweep/compact: For the old generation, V8 uses a mark-and-sweep collector with compaction. This means it will occasionally stop the world (stop JS execution briefly), mark all reachable objects (tracing from roots like the global object), then sweep to reclaim memory from unreferenced objects. It may also compact memory (moving objects to reduce fragmentation). However, Orinoco has made much of the marking concurrent - it can do a lot of the marking on a background thread while JS is still running, to minimize pause times.
Incremental GC: V8 performs garbage collection in small slices rather than one big pause when possible. This incremental approach spreads work out to avoid jank. For example, it can interleave a bit of marking work between script executions, using idle time.
Parallel GC: On multi-core machines, V8 can perform parts of GC (like marking or sweeping) in parallel threads as well.
The net effect is that the V8 team has managed to drastically reduce GC pause times over the years, making garbage collection mostly unnoticeable even in large applications. Minor GCs (new object scavenge) usually happen very fast. Major GCs (old gen) are rarer and mostly concurrent now. If you open Chrome's Task Manager or DevTools Memory panel, you might see V8's heap broken into "Young space" and "Old space" reflecting this generational design.
For developers, this means manual memory management isn't needed, but you should still be mindful: e.g. avoid creating tons of short-lived objects in tight loops (though V8 is quite good at handling short-lived objects) and be aware that holding onto large data structures will keep them around in memory. Tools like DevTools can force a garbage collection or record memory profiles to see what is using memory.
V8 and Web APIs: It's worth mentioning that V8 covers the core JavaScript language and runtime (execution, standard JS objects, etc.), but many "browser APIs" (like DOM methods, alert(), network XHR/fetch, etc.) are not part of V8 itself. Those are provided by the browser and are exposed to JS via bindings. For instance, when you call document.querySelector, under the hood it enters the engine's binding to the C++ DOM implementation. V8 handles calling into C++ and getting results back, and there is a lot of machinery to make this boundary fast (Chrome uses an IDL to generate efficient bindings).
Having covered how the browser fetches resources, parses HTML/CSS, computes layout, paints with the GPU, and runs JS, we now have a picture of the entire process of loading and rendering a page. But there's more to explore: how ES modules are handled (since modules involve their own loading mechanism), how the browser's multi-process architecture is organized, and how security features like sandboxing and site isolation work.
Module Loading and Import Maps
JavaScript modules (ES6 modules) introduce a different loading and execution model compared to classic <script> tags. Instead of a big script file that might create globals, modules are files that explicitly import/export values. Let's see how browsers (and specifically V8 in Chrome) load modules and how features like dynamic import() and import maps come into play.
Static module imports: When the browser encounters a <script type="module" src="main.js">, it treats main.js as a module entry point. The loading process works as follows: the browser will fetch main.js, then parse it as an ES module. During parsing, it will find any import statements (e.g. import { foo } from './utils.js';). Rather than executing code immediately, the browser constructs a module dependency graph. It will initiate fetching of any imported modules (utils.js in this case), and recursively, each of those modules is parsed for their imports, fetched, and so on. This happens asynchronously. Only once the entire graph of modules is fetched and parsed can the browser evaluate the modules. Module scripts are deferred by nature - the browser doesn't execute the module code until all dependencies are ready. Then it executes them in dependency order (ensuring that if module A imports B, B runs first).
This static import process is why ES modules can't be loaded from file:// in some cases unless allowed, and why they require CORS by default for cross-origin scripts - the browser is actively linking and loading multiple files, not just dropping a <script> into the page.
Dynamic import(): In addition to static import statements, ES2020 introduced import(moduleSpecifier) as an expression. This allows code to load a module on the fly (returning a promise that resolves to the module exports). For example, you might do const module = await import('./analytics.js') in response to a user action, thereby code-splitting your application. Under the hood, import() triggers the browser to fetch the requested module (and its dependencies, if not already loaded), then instantiate and execute it, and resolve the promise with the module namespace object. V8 and the browser coordinate here: the browser's module loader handles fetching and parsing, V8 handles the compilation and execution once ready. Dynamic import is powerful because it can be used in non-module scripts too (e.g. an inline script can dynamically import a module). It essentially gives the developer control to load JS on demand. The difference from a static import is that static imports are resolved ahead of time (before any module code runs, the entire graph is loaded), whereas dynamic import behaves more like loading a new script at runtime (except with module semantics and promises).
Import maps: One challenge with ES modules in the browser was the module specifiers. In Node or bundlers, you often import by package name (e.g. import { compile } from 'react'). On the web, without a bundler, 'react' is not a valid URL - the browser would treat it as a relative path (which would fail). This is where Import Maps come in. An import map is a JSON configuration that tells the browser how to resolve module specifiers to real URLs. It's provided via a <script type="importmap"> tag in HTML. For example, an import map might say that the specifier "react" maps to "https://cdn.example.com/react@19.0.0/index.js" (some full URL to the actual script). Then, when any module does import 'react', the browser uses the map to find the URL and loads that. Essentially, import maps allow "bare" specifiers (like package names) to work on the web by mapping them to CDN URLs or local paths.
Import maps have been a game-changer for unbundled development. Since 2023, import maps are supported in all major browsers (Chrome 89+, Firefox 108+, Safari 16.4+ - all three engines). They are especially useful for local development or simple apps where you want to use modules without a build step. For production, large apps often still bundle for performance (to reduce the number of requests), but as browsers and HTTP/2/3 improve, serving many small modules becomes more viable.
The module loader in the browser thus consists of: a module map (tracking what's been loaded), possibly an import map (for custom resolution), and the fetching/parsing logic. Once fetched and compiled, module code executes in strict mode and with its own top-level scope (no leaking to window unless explicitly attached). The exports are cached so if another module imports the same module later, it doesn't re-run it (it reuses the already evaluated module record).
One more aspect to mention is that ES modules, unlike scripts, defer execution and also execute in order for a given graph. If main.js imports util.js and util.js imports dep.js, the evaluation order will be: dep.js first, then util.js, then main.js (depth-first, post-order). This deterministic order can avoid the need for things like DOMContentLoaded in some cases, since by the time your main module runs, all its imports are loaded and executed.
From V8's perspective, modules are handled by the same compilation pipeline, but they create separate ModuleRecords. The engine ensures that a module's top-level code only runs once all dependencies are ready. V8 also has to deal with cyclic module imports (which are allowed and can lead to partially initialized exports). The details are per spec - but essentially, the engine will create all module instances, then resolve cycles by giving them placeholders, and then execute in an order that respects dependencies (the spec algorithm is the "DAG" topological sort of the module graph).
In summary, module loading in browsers is a coordinated dance between the network (fetching module files), the module resolver (using import maps or standard URL resolution), and the JS engine (compiling and evaluating modules in the correct order). It's more involved than old <script> loading, but results in a more modular and maintainable code structure. For developers, the key takeaways are: use modules to organize code, use import maps if you want bare imports, and know that you can dynamically load modules when needed via import(). The browser will handle the heavy lifting of making sure everything executes in the right sequence.
Now that we've covered how a single page's internals work, let's zoom out and examine the browser architecture that allows multiple pages, tabs, and web apps to all run simultaneously without interfering with each other. This brings us to the multi-process model.
Browser Multi-Process Architecture
Modern browsers (Chrome, Firefox, Safari, Edge, etc.) all use a multi-process architecture for stability, security, and performance isolation. Instead of running the entire browser as one giant process (which was how early browsers worked), different aspects of the browser run in different processes. Chrome was a pioneer of this approach in 2008, and others followed suit in various forms. Let's focus on Chromium's architecture and note differences in Firefox and Safari.
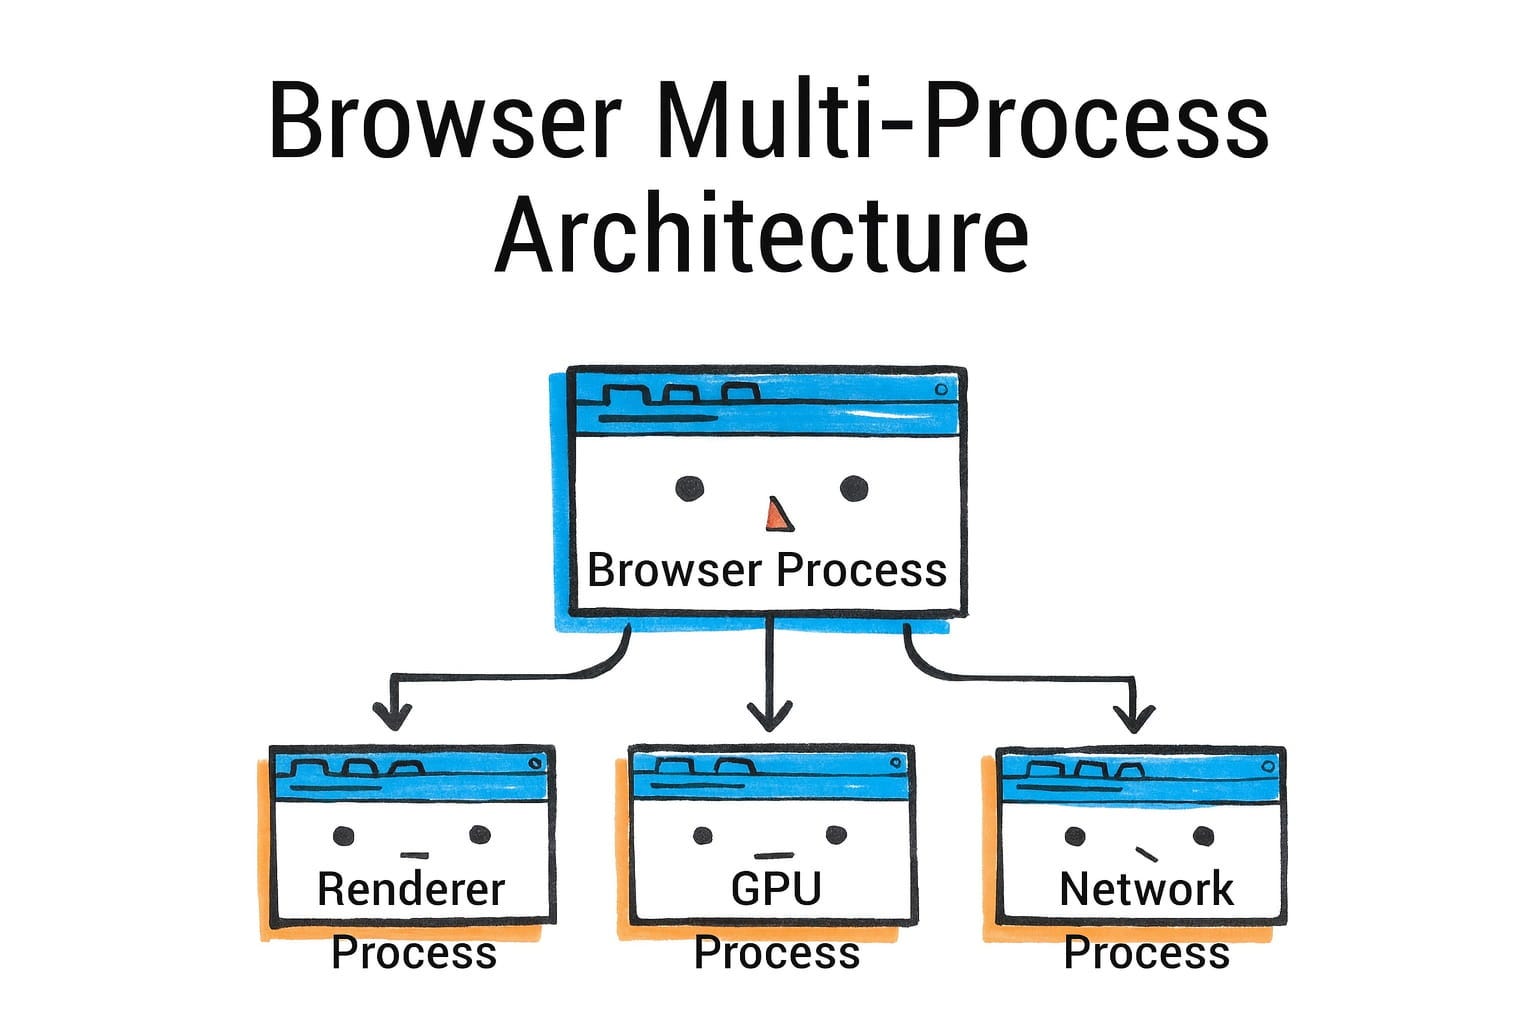
In Chromium (Chrome, Edge, Brave, etc.), there is one Browser Process that is central. This browser process is responsible for the UI (the address bar, bookmarks, menus - all the browser chrome) and for coordinating high-level tasks like resource loading and navigation. When you open Chrome and see one entry in your OS task manager, that's the browser process. It's also the parent that spawns other processes.
Then, for each tab (and sometimes for each site in a tab), Chrome creates a Renderer Process. A renderer process runs the Blink rendering engine and V8 JS engine for the content of that tab. In general, each tab gets at least one renderer process.
If you have multiple unrelated sites open, they'll be in separate processes (Site A in one, Site B in another, etc.). Chrome even isolates cross-origin iframes into separate processes (more on that in site isolation). The renderer process is sandboxed and cannot directly access your file system or network arbitrarily - it has to go through the browser process for those privileged operations.
Other key processes in Chrome include:
GPU Process: a process dedicated to communicating with the GPU (as described earlier). All rendering and compositing requests from renderers go to the GPU process, which actually issues graphics API calls. This process is sandboxed and separate so that a GPU crash doesn't take down renderers.
Network Process: (In older Chrome versions the network was a thread in browser process, but now it's often a separate process through "servicification"). This process handles network requests, DNS, etc. and can be sandboxed separately.
Utility Processes: these are for various services (like audio playback, image decoding, etc.) that Chrome may offload.
Plugin Process: in the era of Flash and NPAPI plugins, plugins ran in their own process. Flash is deprecated now, so this is less relevant, but the architecture remains ready for plugins to not run in the main browser process.
Extension Processes: Chrome extensions (which are essentially scripts that can act on web pages or the browser) run in separate processes as well, isolated from websites for security.
A simplified view is: one Browser process coordinates multiple Renderer processes (one per tab or per site instance), plus one GPU process and a few others for services. Chrome's task manager (Shift+Esc on Windows or via More Tools > Task Manager) will actually list each process type and its memory usage.
Benefits of Multi-Process: The primary benefits are:
Stability: If a web page (renderer process) crashes or leaks memory, it doesn't crash the whole browser - you can close that tab and the rest stays alive. In one-process browsers, a single bad script could tear down everything. Chrome can show the "Aw, Snap" error for a single tab when its process dies, and you can reload it independently.
Security (Sandboxing): By running web content in a restricted process, the browser can limit what that code can do on your system. Even if an attacker finds a vulnerability in the rendering engine, they are trapped in the sandbox - the renderer process typically cannot read your files or arbitrarily open network connections or launch programs. It must request the browser process for things like file access, which can be validated or denied. This sandbox is enforced at the OS level (using job objects, seccomp filters, etc. depending on platform).
Performance Isolation: Intensive work in one tab (a heavy webapp or an infinite loop) is mostly confined to that tab's renderer process. Other tabs (different process) can remain responsive because their processes aren't blocked. Also, the OS can schedule processes on different CPU cores - so two heavy pages can run in parallel on a multi-core system better than if they were threads of one process.
Memory segmentation: Each process has its own address space, so memory is not shared. This prevents one site from snooping on data of another and also means when a tab is closed, the OS can reclaim all memory from that process efficiently. The downside is some overhead due to duplicated resources and processes (each renderer loads its own copy of the JS engine, etc.).
Site Isolation: Initially, Chrome's model was one process per tab. Over time they evolved it to one process per site (especially after Spectre - see next section on security). As of 2024, site isolation is enabled by default for 99% of Chrome users across desktop platforms, with Android support continuing to be refined. This means if you have two tabs both open to example.com, Chrome might decide to use one process for both (to save memory, because they're the same site and thus less risky to put together). But a tab with example.com and an iframe of evil.com would by default put evil.com's iframe in a separate process from the parent page (to protect the example.com data). This enforcement is what Chrome calls "Strict Site Isolation" (launched around Chrome 67 as a default). Site isolation causes Chrome to use 10-13% more system resources due to increased process creation, but provides crucial security benefits.
Firefox's architecture, called Electrolysis (e10s), was historically one content process for all tabs (for many years Firefox was single-process and only enabled a few content processes around 2017). As of 2021, Firefox uses multiple content processes (by default 8 for web content). With Project Fission (site isolation), Firefox is moving toward isolating sites similarly - it can spin up new processes for cross-site iframes, and in Firefox 108+ they enabled site isolation by default, increasing the number of processes to potentially one per site like Chrome. Firefox also has a GPU process (for WebRender and compositing) and a separate networking process, similar to Chrome's split. So in practice, Firefox now has a very Chrome-like model: a parent process, a GPU process, a network process, a few content (renderer) processes, and some utility processes (for extensions, media decoding, etc. - e.g. a media plugin can run isolated).
Safari (WebKit) likewise moved to a multi-process model (WebKit2) where each tab's content is in a separate WebContent process and a central UI process controls them. Safari's WebContent processes are also sandboxed and cannot directly access devices or files without going through the UI process. Safari also has a networking process that is shared (and possibly other helpers). So while implementations differ, the concept is consistent: isolate each webpage's code in its own sandboxed environment.
One important point is inter-process communication (IPC): How do these processes talk to each other? Browsers use IPC mechanisms (on Windows, often named pipes or other OS IPC; on Linux, maybe Unix domain sockets or shared memory; Chrome has its own IPC library Mojo). For example, when a network response arrives in the Network process, it needs to be delivered to the correct Renderer process (via the Browser process coordinating). Similarly, when you do a DOM fetch(), the JS engine will call into a network API which sends a request to the Network process and so on. IPC adds complexity, but browsers optimize heavily (e.g. using shared memory for transferring large data like images efficiently, and posting asynchronous messages to avoid blocking).
Process Allocation Strategies: Chrome doesn't always create a brand new process for every single tab - there are limits (particularly on devices with low memory, it may reuse processes for same-site tabs). Chrome will reuse an existing renderer if you open another tab to the same site, to conserve memory (this is why sometimes two tabs of the same site share process). It also has a limit on total processes (which can scale based on RAM). When the limit is hit, it might start putting multiple unrelated sites in one process, though it tries hard to avoid mixing sites if site isolation is enabled. On Android, Chrome uses fewer processes because of the memory constraints (often a max of 5-6 processes for content).
One more concept in Chromium is servicification: splitting browser components into services that could run in separate processes. For example, the Network Service was made a separate module that can run out-of-process. The idea is modularity - powerful systems can run each service in its own process, whereas constrained devices might consolidate some services back into one process to save overhead. Chrome can decide at runtime or build time how to deploy these services. As noted in the snippet, on high-end it might split everything (UI, net, GPU, etc. all separate), and on low-end (Android) it might combine browser & network in one process to cut down overhead.
The takeaway: Chromium's architecture is designed to run the browser UI and each site in different sandboxes, using processes as the isolation boundary. Firefox and Safari have converged on similar designs. This architecture greatly improves security and reliability at the cost of more memory usage. The web content processes are treated as untrusted, and that's where site isolation (next section) comes into play to even isolate different origins from each other within separate processes.
Site Isolation and Sandboxing
Site isolation and sandboxing are security features that build on the multi-process foundation. They aim to ensure that even if malicious code runs in the browser, it cannot easily steal data from other sites or access your system.
Site Isolation: We've touched on this - it means that different websites (different sites, more strictly) run in different renderer processes. Chrome's site isolation was boosted after the Spectre vulnerability came to light in 2018. Spectre showed that malicious JavaScript could potentially read memory it shouldn't (by exploiting CPU speculative execution). If two sites were in the same process, a malicious site could use Spectre to snoop on memory of the sensitive site (like your banking site). The only robust solution is to not let them share a process at all. So Chrome made site isolation a default: every site gets its own process, including cross-origin iframes. Firefox has followed with Project Fission (enabled by default in recent versions), which aims for the same - they cite isolating every site in its own process for security. This is a significant change from the past where if you had a parent page and multiple iframes from various domains, they might all live in one process (especially if they were in one tab). Now, those iframes would be split so that e.g. an <iframe src="https://evil.com"> on a good site page is forced into a different process, preventing even low-level attacks from leaking info between them.
From a developer point of view, site isolation is mostly transparent. One implication is that communications between an embedded iframe and its parent might cross process boundaries now, so things like postMessage between them are implemented via IPC under the hood. But the browser makes this seamless; you as a dev just use the APIs as normal.
Sandboxing: Each renderer process (and other auxiliary processes) run in a sandbox with restricted privileges. For example, on Windows, Chrome uses a job object and drops privileges so the renderer can't call most Win32 APIs that access the system. On Linux, it uses namespaces and seccomp filters to limit syscalls. The renderer basically can compute and render content but if it tries to open a file or camera or microphone, it will be blocked (unless going through proper channels that ask user permission via the browser process). WebKit's documentation explicitly notes that WebContent processes have no direct access to filesystem, clipboard, devices, etc. - they must request via the UI process which mediates. This is why, for example, when a site tries to use your microphone, the permission prompt is shown by the browser UI (browser process) and if allowed, the actual recording is done in a controlled process. The sandbox is a crucial line of defense. Even if an attacker finds a bug to run native code in the renderer, they then face the sandbox barrier - they'd need a separate exploit (an "escape") to break out to the system. This layered approach (called site isolation + sandbox) is state-of-the-art for browser security.
Firefox's sandboxing is also quite strict now (it was weaker in early e10s days but they ramped it up). Firefox content processes can't directly access much either; and Firefox also sandboxes the GPU process to handle graphics driver issues.
Out-of-Process iframes (OOPIF): In Chrome's implementation of site isolation, they invented the term OOPIF for out-of-process iframe. From a user's perspective, nothing changes, but in Chrome's internal architecture, each frame of a page can potentially be backed by a different renderer process. The top-level frame and same-site frames share one process; cross-site frames use different processes. All those processes "cooperate" to render a single tab's content, coordinated by the browser process. This is pretty complex, but Chrome has a frame tree that can span processes. It means your one tab might be running N processes (one for the main document, others for each cross-site subdocument). They communicate via IPC for things like DOM events crossing the boundary or certain JavaScript calls that involve cross-context. The web platform (through specs like COOP/COEP, SharedArrayBuffer, etc.) is evolving with these constraints in mind after Spectre.
Memory and Performance Costs: Site isolation does increase memory usage because more processes are used. Chrome devs noted it could be a 10-20% memory overhead in some cases. They mitigated some by something called "best-effort process consolidation" for same-site, and by limiting how many processes can be spawned (we mentioned earlier). Firefox initially didn't isolate every site due to memory concerns but after Spectre they found ways to do it more efficiently with 8-privileged-process limit and on-demand process creation. Safari historically has a strong process model but I'm not sure if it isolates cross-site iframes; WebKit2 certainly isolates top-level pages. Apple's focus is often also on privacy (Intelligent Tracking Prevention will partition cookies, etc.), but that's a different layer.
Cross-site prefetches are limited for privacy reasons and will currently only work if the user has no cookies set for the destination site, preventing sites from tracking user activity via prefetched pages that may never be visited.
All in all, site isolation ensures that the principle of least privilege is applied: code from origin A cannot access data from origin B unless via web APIs with explicit consent (like postMessage or storage that's partitioned). And the sandbox ensures that even if code is rogue, it can't touch your system directly. These measures make browser exploits much harder - an attacker typically needs multiple chain exploits now (one to break renderer, one to escape sandbox) to do serious damage, which raises the bar significantly.
As a web developer, you might not directly feel site isolation, but you benefit from it through a safer web. One thing to be aware of is that cross-origin interactions might have slightly more overhead (because of IPC) and that some optimizations like in-process script sharing aren't possible across origins. But browsers are continuously optimizing the messaging between processes to minimize any performance hit.
Now, after covering security, let's turn to tools and performance instrumentation - essentially, how we developers can peek into this pipeline and measure or debug it.
Comparing Chromium, Gecko, and WebKit
We've mainly described Chrome/Chromium's behavior (Blink engine for HTML/CSS, V8 for JS, multi-process via Aura/Chromium infrastructure). Other major engines - Mozilla's Gecko (used in Firefox) and Apple's WebKit (used in Safari) - share the same fundamental goals and a broadly similar pipeline, but there are noteworthy differences and historical divergences.
Shared Concepts: All engines parse HTML into a DOM, parse CSS into style data, compute layout, and paint/composite. All have JS engines with JITs and garbage collection. And all modern ones are multi-process (or at least multi-threaded) for parallelism and security.
Differences in CSS/Style System
One interesting difference is how CSS style computation is implemented by rendering engine:
Blink (Chromium): Uses a single-threaded style engine in C++ (historically based on WebKit's). It computes style sequentially for the DOM tree. It has had incremental style invalidation optimizations, but by and large it's one thread doing the work (apart from some minor parallelization in animation).
Gecko (Firefox): In the Quantum project (2017), Firefox integrated Stylo, a new CSS engine written in Rust, which is multi-threaded. Firefox can calculate style for different DOM subtrees in parallel using all CPU cores. This was a major performance improvement for CSS in Gecko. So, style recalculation in Firefox might use 4 cores to do what Blink does on 1. This is one advantage of Gecko's approach (at the cost of complexity).
WebKit (Safari): WebKit's style engine is single-threaded like Blink (since Blink forked from WebKit in 2013, they shared architecture up to that point). WebKit has done interesting things like a bytecode JIT for CSS selectors matching. It may transform CSS selectors into bytecode and JIT compile a matcher for speed. Blink did not adopt that (it uses iterative matching).
So, in CSS, Gecko stands out with parallel style computation via Rust. Blink and WebKit rely on optimized C++ and maybe some JIT tricks (in WebKit's case).
Layout and Graphics
All three engines implement the CSS box model and layout algorithms. Specific features might land in one before others (e.g. at one time WebKit was ahead in CSS Grid support, then Blink caught up - often they share code through standards bodies).
Firefox (Gecko) made a huge change by introducing WebRender as its compositor/rasterizer. WebRender is now the default rendering engine in Firefox and has contributed to significant performance improvements, particularly for graphics-intensive web content. WebRender (also Rust) basically takes the display list and renders it on the GPU directly, handling things like tessellating shapes, text, etc. with the GPU. It's like moving more painting work to the GPU. In Chrome's pipeline, rasterization is still done on CPU (for most content) then sent to GPU as bitmaps. WebRender tries to avoid making bitmaps for whole layers and instead draw vectors on GPU (except for text glyphs which it caches as atlas textures). This means Firefox can potentially animate more content at high performance because it doesn't need to re-rasterize everything if only small portions change - it can redraw via GPU very quickly. It's akin to how a game engine redraws a scene every frame using GPU calls. The downside is it's complex to implement and tune, and can stress the GPU more. But as GPU power grows, this approach is forward-looking. Chrome's team considered a similar approach ("SKIA GPU" path) but has not done a full WebRender style overhaul.
Safari (WebKit) uses an approach more similar to older Chrome: it has a converts the compositor with layers (called CALayer, since on Mac and iOS it uses Core Animation layers). Safari was early to move to GPU compositing (iPhone OS and Safari 4 in 2009 had hardware-accelerated compositing for certain CSS like transforms). Safari and Chrome diverged but conceptually both do tiling and compositing. Safari also offloads a lot to the GPU (and uses tiling, especially on iOS where tile drawing was fundamental for smooth scrolling).
Mobile optimizations: Each engine has special cases for mobile. For example, WebKit has the concept of tile coverage for scrolling (used in iOS's UIWebView historically). Chrome on Android uses "tiling" and tries to keep raster tasks minimal to hit frame rates. Firefox's WebRender came from the mobile-first Servo project.
JavaScript Engines
V8 (Chromium) we described: Ignition, Sparkplug, TurboFan, Maglev as of 2023.
SpiderMonkey (Firefox): It historically had an interpreter, then a Baseline JIT and an optimizing JIT (IonMonkey). Recent work (Warp) changed how JIT tiers work, potentially simplifying Ion and making it more like TurboFan's approach to use cached bytecode and type info. SpiderMonkey also has a different GC (also generational, called Incremental GC since 2012, and now mostly incremental/concurrent).
JavaScriptCore (Safari): As noted, it has 4 tiers (LLInt, Baseline, DFG, FTL). It uses a different GC (WebKit's GC is a generational mark-sweep called Butterfly or Boehm variations historically, now bmalloc etc.). JSC's FTL uses LLVM to optimize, which is unique (V8 and SM have their own compilers, JSC leverages LLVM for one tier). This can yield very fast code, but the compilation is heavy. JSC tends to prioritize peak performance on certain benchmarks (it often shines on some, but V8 tends to catch up; they leapfrog).
In terms of ES features, all three engines are pretty much up-to-date with the latest standards, thanks to test262 and each other's competition.
Multi-Process Model Differences
Chrome: each tab typically separate, site isolation at origin level, lots of processes (can be dozens).
Firefox: fewer processes by default (8 content processes handling all tabs, plus more if needed for cross-site iframes with Fission). So, it's not necessarily one process per tab; tabs share content processes in a pool. This means Firefox might have lower memory usage under many-tab scenarios, but it also means one content process crash can take out multiple tabs (though it tries to group by site, so maybe all Facebook tabs in one process, etc.).
Safari: likely one process per tab (or per a few tabs) - on iOS, WKWebView definitely isolates each webview. Safari desktop historically did each tab separate as well. Not sure if they isolate cross-origin iframes yet - Apple hasn't talked about Spectre mitigations much, but Safari does have process per domain for top-level at least.
Interprocess Coordination: All engines have to solve similar problems like how to implement alert() (which blocks JS) in a multi-process environment - typically the browser process shows the alert UI and pauses that script context. Or how to handle prompt/confirm, how to do Modal dialogs, etc. There are subtle differences (e.g. Chrome doesn't truly block the thread for alert - it spins a nested runloop in the renderer, etc. whereas Firefox might still freeze that tab's process).
Crash handling: Chrome and Firefox both have crash reporters that can restart a crashed content process and show an error in the tab. Safari's Web Content process crash typically will display a simpler error message in the content area.
Feature Implementation Divergence
Some web platform features are engine-specific: e.g. Chrome has an experimental document.transition API for seamless DOM transitions, which relies on Blink's architecture. Firefox might implement something differently or later. But eventually, standards converge features.
Developer tools: Chrome's DevTools is very advanced. Firefox's DevTools also very good (with some unique features like CSS Grid highlighters early on, shape editor). Safari's Web Inspector is fine but not as full-featured in some areas. These differences can matter to devs debugging in each browser.
Performance Trade-offs
Historically, Chrome was lauded for faster JS and overall performance due to multi-process and V8. Firefox with Quantum closed a lot of gaps, sometimes surpassing Chrome in graphics (WebRender can be very fast for complex pages). Safari often excels in graphics and low power usage on Apple hardware (they optimize for power a lot).
Memory: Chrome has a reputation for high memory usage (all those processes). Firefox tries to be a bit more conservative. Safari is very memory efficient on iOS out of necessity (limited RAM), and they do a lot of memory optimization in WebKit.
External Contributors: Interesting note - a lot of improvements in these engines come from external teams like Igalia (e.g. implementing CSS Grid in both WebKit and Blink). So sometimes features land roughly simultaneously.
From a web developer's perspective, the differences often manifest as:
Needing to test on all engines because there might be slight differences or bugs in one's implementation of a CSS feature or an API.
Performance might differ (for example, a particular JS workload might be faster in one engine than another due to JIT heuristics).
Some APIs might not be available in one (Safari is often last to implement some new APIs like WebRTC or IndexedDB versions, etc. though they eventually do).
But the core concepts we discussed (network -> parse -> layout -> paint -> composite -> JS execution) apply to all, just with varying internal approaches or names:
In Gecko: parse -> frame tree -> display list -> WebRender scene or layer tree (if WebRender disabled) -> composite.
In WebKit: parse -> render tree -> graphics layers -> composite (via CoreAnimation).
And all have analogous subsystems (DOM, styling, layout, graphics, JS engine, networking, processes/threads).
Knowing these helps in debugging: e.g. if something is janky in Safari but not Chrome, it could be WebKit's painting differs. Or if CSS is slow in Firefox, maybe it's hitting a path that isn't parallelized by Stylo (though that's rare).
To sum up, while Chromium, Gecko, and WebKit have different implementations and even some different innovations (parallel CSS in Gecko, WebRender GPU, etc.), they increasingly implement the same web standards and even collaborate on many. The choice of engine matters more for the platform vendors and open web diversity, but as a developer you mostly care that your site runs everywhere. Under the hood, each engine's unique architecture might lead to different performance profiles or bugs, which is why testing and using performance diagnostics in each (like Firefox's performance tool vs Chrome's) can be insightful. It's beyond our scope to list all differences, but hopefully this gives an idea of the landscape: they are convergent in high-level design (multi-process, similar pipelines) yet divergent in specific technical solutions.
Conclusion and Further Reading
We've journeyed through the life of a web page inside a modern browser - from the moment a URL is entered, through networking and navigation, HTML parsing, styling, layout, painting, and JavaScript execution, all the way to the GPU putting pixels on the screen. We've seen that browsers are essentially mini operating systems: managing processes, threads, memory, and a slew of complex subsystems to ensure web content loads fast and runs securely. For web developers, understanding these internals can demystify why certain best practices (like minimizing reflows or using async scripts) matter for performance, or why some security policies (like not mixing origins in iframes) exist.
A few key takeaways for developers:
Optimize network usage: Fewer round trips and smaller files = faster start render. The browser can do a lot (HTTP/2, caching, speculative loading) but you should still leverage techniques like resource hints and efficient caching. The networking stack is high-performance, but latency is always a killer.
Structure your HTML/CSS for efficiency: A well-structured DOM and lean CSS (avoid very deep trees or overly complex selectors) can help the parsing and style systems. Understand that CSS and DOM build computed style, then layout computes geometry - heavy DOM manipulations or style changes can trigger these recalculations.
Batch DOM updates: to avoid repeated style/layout thrash. Use DevTools Performance panel to catch when your script is causing many layouts or paints.
Use compositing-friendly CSS for animations: Animations of transform or opacity stay off the main thread and on the compositor, yielding smooth animations. Avoid animating layout-bound properties if possible.
Mind the JS execution: Though JS engines are super-fast, long tasks will block the main thread. Break up long operations (so the page stays responsive) and in some cases consider Web Workers for background tasks. Also, remember that heavy JS can cause GC pauses (rarely long nowadays, but can happen if memory balloons).
Security features: Embrace them - e.g. use iframe sandbox or rel=noopener when appropriate, because you now know the browser will isolate those anyway; cooperating with it is good.
DevTools is your friend: The performance and network panels in particular are gold mines for seeing exactly what the browser is doing. If something is slow or janky, the tools often point to the cause (a long layout, a slow paint, etc.).
For those eager to dive even deeper, an excellent resource is Browser Engineering by Pavel Panchekha and Chris Harrelson (available at browser.engineering).
It's essentially a free online book that guides you through building a simple web browser, covering networking, HTML/CSS parsing, layout, and more in an accessible way. It can serve as a more in-depth companion to everything we discussed, solidifying knowledge by example. Additionally, the Chrome team's multi-part series "Inside look at modern web browser" provides a readable overview with diagrams. The V8 blog (v8.dev) and Mozilla's Hacks blog are great for learning about engine advances (e.g. new JIT compiler tiers or WebRender internals).
In conclusion, modern browsers are marvels of software engineering. They successfully abstract away all this complexity so that as developers we mostly just write HTML/CSS/JS and trust the browser to handle it. Yet, by peering under the hood, we gain insights that help us write more performant, robust applications. We appreciate why certain techniques improve user experience (e.g. avoiding blocking the main thread, or reducing unnecessary DOM complexity) because we see how the browser has to work under the covers. The next time you debug a webpage or wonder why Chrome or Firefox behaves a certain way, you'll have a mental model of the browser's internals to guide you.
Happy building, and remember that the web platform's depth rewards those who explore it - there's always more to learn, and tools to help you learn it.
Further Reading
Web Browser Engineering - How browsers work deep-dive book
Chromium University - Free series of deep-dive videos into how Chromium works, including the excellent Life of a Pixel talk
Inside the Browser (Chrome Developers Blog series) - parts 1-4 cover architecture, navigation flow, rendering pipeline, and input/controller threads.
Illustrations in this piece were commissioned from Susie Lu.

excellent article <3
Brilliant explanation 👏